
Mathematics, 21.05.2020 03:05 tursunovarukhshona
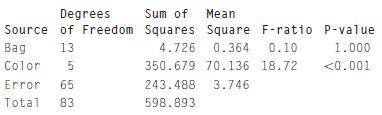
Each student in a statistics class had a randomly assigned bag of candies and counted the number of each color (Blue, Red, Orange, Green, Brown, Yellow). The bags were all the same size. The investigators claimed to use a randomized block design, with Bag as the blocking factor. They counted the number of candies of each color in each bag. Their results are reproduced in the given ANOVA output. Complete parts (a) through (c).
Source Degrees Sum of Mean F-ratio P-value
of Freedom Squares Square
Bag 13 4.726 0.364 0.10 1.000
Color 6 350.679 70.136 18.72 <0.001
Error 65 243.488 3.746
Total 83 598.893
(a) Was this an observational or experimental study?
(b) What was the treatment? What factors were manipulated?
A. The factors were color and bag and the treatments were all possible combinations of those two factors.
B. The factors were bag and student and the treatments were all possible combinations of those two factors.
C. The factors were color and student and the treatments were all possible combinations of those two factors
D. There is no treatment. No factors were manipulated.
(c) What was the response variable?

Answers: 3


Another question on Mathematics
Mathematics, 21.06.2019 13:00
Add 1/7 + -1/7 your answer should be reduced to its smallest form and should not be an improper fraction
Answers: 1
Mathematics, 21.06.2019 16:10
Abox contains 1 plain pencil and 4 pens. a second box contains 5 color pencils and 5 crayons. one item from each box is chosen at random. what is the probability that a plain pencil from the first box and a color pencil from the second box are selected? write your answer as a fraction in simplest form.
Answers: 1
Mathematics, 21.06.2019 17:30
Lems1. the following data set represents the scores on intelligence quotient(iq) examinations of 40 sixth-grade students at a particular school: 114, 122, 103, 118, 99, 105, 134, 125, 117, 106, 109, 104, 111, 127,133, 111, 117, 103, 120, 98, 100, 130, 141, 119, 128, 106, 109, 115,113, 121, 100, 130, 125, 117, 119, 113, 104, 108, 110, 102(a) present this data set in a frequency histogram.(b) which class interval contains the greatest number of data values? (c) is there a roughly equal number of data in each class interval? (d) does the histogram appear to be approximately symmetric? if so,about which interval is it approximately symmetric?
Answers: 3
Mathematics, 21.06.2019 17:30
Terri makes a quilt using three sizes of fabric squares the side lenght of each fabric square is the square root of the area
Answers: 2
You know the right answer?
Each student in a statistics class had a randomly assigned bag of candies and counted the number of...
Questions


Advanced Placement (AP), 04.03.2021 21:20

Mathematics, 04.03.2021 21:20

History, 04.03.2021 21:20
Biology, 04.03.2021 21:20
Mathematics, 04.03.2021 21:20
Biology, 04.03.2021 21:20

Mathematics, 04.03.2021 21:20

Arts, 04.03.2021 21:20
Mathematics, 04.03.2021 21:20

Mathematics, 04.03.2021 21:20
Mathematics, 04.03.2021 21:20


