
Mathematics, 06.05.2020 22:22 joeylozier15
HELP ASAP 1.Go to the website for the U. S. Bureau of Labor Statistics: www. bls. gov. Under the Subject Areas tab, look under Pay & Benefits, and choose Wages by Area & Occupation. Then select the link for the National Wage Data for over 800 occupations.
2. You will first see a list of major occupational groups. Below this list is the full table of jobs. From this list, select a job that you are interested in. Do not pick the occupation used in the project sample. Notice that you can select a link from the major occupational group’s list to automatically move to a certain part of the table.
(a)In the list, you will see rows for general categories, such as Secretaries and Administrative Assistants. These categories do not have active links (not underlined). They are followed by detailed occupations under that category, such as Legal Secretaries and Medical Secretaries. These have active links (underlined). Choose a more detailed (underlined) occupation.
Tip: If you cannot find a particular occupation you are looking for, try different wording. For example, look for musician instead of rock star.
(b)Select the link for your chosen occupation. You will see a brief description of the job followed by mean wages.
3.Open your presentation. On slide 1, type your name. On slide 2, record the occupation title, occupation code (shown in the form xx-x), mean hourly wage, and annual mean wage of your chosen career. If one of these amounts is missing, calculate it. Assume working 40 h/week for 52 weeks. Then summarize the duties of an employee with this job. Do not copy the description from the website word for word.
Project Writing
1.Complete Lesson Checkpoint: Paycheck Deductions, an online, ungraded assessment. You’ll practice calculating Social Security and Medicare taxes—a skill essential to completing your project. Reach out to your teacher with any questions you have after taking this assessment.
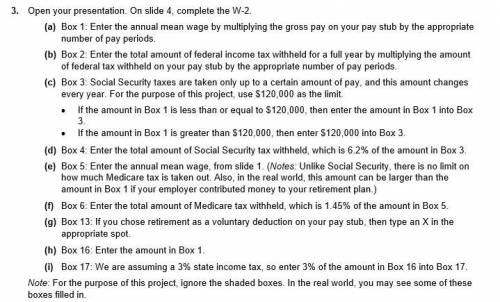
2.Open your presentation. On slide 3, complete the pay stub.
(a)Choose a pay period. Choose weekly, biweekly, semimonthly, or monthly. Then choose if the job is paid by hourly wages or by a given salary. Complete the first sentence on the slide.
(b)Use the mean wages on slide 1 to calculate the gross pay for your chosen pay period. On the slide, briefly show or explain how you determined this amount. For example, multiply the hourly wage by 40, or divide the annual wage by the appropriate number of pay periods. (Note: Assume 40 hours if working an hourly wage.) Fill in the gross pay amount on the pay stub under Gross Pay.
(c)Use the gross pay amounts and the table below to determine the amount of federal income tax withheld. (Note: This table estimates a typical withholding amount for a single employee with no dependents. Actual federal withholding amounts in the real world will differ.)
Annual Gross Income Federal Income Tax Withheld
Over $10,000 and up to $20,000 6% of gross pay
Over $20,000 and up to $40,000 10% of gross pay
Over $40,000 and up to $60,000 12% of gross pay
Over $60,000 and up to $80,000 16% of gross pay
Over $80,000 and up to $100,000 18% of gross pay
Over $100,000 and up to $120,000 20% of gross pay
Over $120,000 and up to $140,000 21% of gross pay
Over $140,000 and up to $160,000 22% of gross pay
Over $160,000 and up to $200,000 23% of gross pay
Over $200,000 25% of gross pay
Fill in the amount withheld for federal tax on the pay stub next to Federal Tax.
(d) Use the gross pay amount to calculate the Social Security and Medicare taxes. Fill in these amounts on the pay stub.
(e) Use the gross pay amount to determine the state tax. Some states have no income tax. The tax rates for states that do have an income tax vary. For this project, assume a 3% state income tax.
(f) Find the total of the taxes. Fill in the total tax amount on the pay stub under Tax Deductions.
(g) Use the list below to choose voluntary deductions. (Note: This table gives sample amounts only. Actual deductions in the real world will differ.) Choose at least two of these deductions.
• Retirement: Calculate 5% of gross pay.
• Health Insurance: Use an annual deduction of $1650 to calculate the deduction for the pay period.
• Life Insurance: Use an annual deduction of $400 to calculate the deduction for the pay period.
• Disability Insurance: Use an annual deduction of $150 to calculate the deduction for the pay period.
Fill in the calculated amounts on the pay stub. Fill in $0 for deductions not chosen.
(h) Find the total of the voluntary deductions. Fill in the total amount of voluntary deductions on the pay stub under Voluntary Deductions.
(i) Determine the net pay by subtracting the tax deductions and the voluntary deductions from the gross pay. Fill in the net pay on the pay stub under Net Pay.

Answers: 1


Another question on Mathematics
Mathematics, 20.06.2019 18:04
30 determine the coefficient on x 12 y 24 x12y24 in ( x 3 + 2 x y 2 + y + 3 ) 18 . (x3+2xy2+y+3)18. (be careful, as x x and y y now appear in multiple terms! )
Answers: 3
Mathematics, 21.06.2019 16:00
On saturday morning, calls arrive at ticketmaster at a rate of 108 calls per hour. what is the probability of fewer than three calls in a randomly chosen minute?
Answers: 1
Mathematics, 21.06.2019 19:10
Revirite the formula to determine the area covered by one can of paint. alyssa and her father are going to paint the house this summer. they know they'll need 6 cans of paint. enter the correct answer. 000 done a formula that describes this scenario is (licierali 000 oo 6 w w = the total area of the walls p = area covered by a can of paint
Answers: 1
Mathematics, 22.06.2019 00:00
(20 points) a bank has been receiving complaints from real estate agents that their customers have been waiting too long for mortgage confirmations. the bank prides itself on its mortgage application process and decides to investigate the claims. the bank manager takes a random sample of 20 customers whose mortgage applications have been processed in the last 6 months and finds the following wait times (in days): 5, 7, 22, 4, 12, 9, 9, 14, 3, 6, 5, 15, 10, 17, 12, 10, 9, 4, 10, 13 assume that the random variable x measures the number of days a customer waits for mortgage processing at this bank, and assume that x is normally distributed. 2a. find the sample mean of this data (x ě…). 2b. find the sample variance of x. find the variance of x ě…. for (c), (d), and (e), use the appropriate t-distribution 2c. find the 90% confidence interval for the population mean (îľ). 2d. test the hypothesis that îľ is equal to 7 at the 95% confidence level. (should you do a one-tailed or two-tailed test here? ) 2e. what is the approximate p-value of this hypothesis?
Answers: 2
You know the right answer?
HELP ASAP 1.Go to the website for the U. S. Bureau of Labor Statistics: www. bls. gov. Under the Sub...
Questions

SAT, 13.05.2021 07:40

Mathematics, 13.05.2021 07:40
Mathematics, 13.05.2021 07:40
Mathematics, 13.05.2021 07:40
Mathematics, 13.05.2021 07:40

Mathematics, 13.05.2021 07:40

English, 13.05.2021 07:40
History, 13.05.2021 07:40
Mathematics, 13.05.2021 07:40
Mathematics, 13.05.2021 07:40


