Using the number line below find the
probability, as a decimal to the nearest
hundredth,...

Mathematics, 06.05.2020 06:46 jamya62
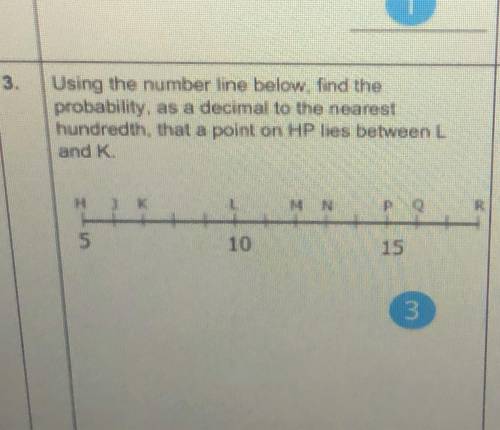
Using the number line below find the
probability, as a decimal to the nearest
hundredth, that a point on HP lies between L
and K.

Answers: 3


Another question on Mathematics
Mathematics, 21.06.2019 23:30
The average daily maximum temperature for laura’s hometown can be modeled by the function f(x)=4.5sin(πx/6)+11.8 , where f(x) is the temperature in °c and x is the month. x = 0 corresponds to january.what is the average daily maximum temperature in may? round to the nearest tenth of a degree if needed.use 3.14 for π .
Answers: 1
Mathematics, 21.06.2019 23:30
The graph of the the function f(x) is given below. find [tex]\lim_{x \to 0\zero} f(x)[/tex] [tex]\lim_{x \to 1+\oneplus} f(x)[/tex] [tex]\lim_{x \to 0-\zeroneg} f(x)[/tex]
Answers: 1
Mathematics, 22.06.2019 02:00
Ethan is proving that the slope between any two points on a straight line is the same. he has already proved that triangles 1 and 2 are similar. drag statements and reasons to complete the proof.
Answers: 1
Mathematics, 22.06.2019 02:30
Atrain traveled for 1.5 hours to the first station, stopped for 30 minutes, then traveled for 4 hours to the final station where it stopped for 1 hour. the total distance traveled is a function of time. which graph most accurately represents this scenario? a graph is shown with the x-axis labeled time (in hours) and the y-axis labeled total distance (in miles). the line begins at the origin and moves upward for 1.5 hours. the line then continues upward at a slow rate until 2 hours. from 2 to 6 hours, the line continues quickly upward. from 6 to 7 hours, it moves downward until it touches the x-axis a graph is shown with the axis labeled time (in hours) and the y axis labeled total distance (in miles). a line is shown beginning at the origin. the line moves upward until 1.5 hours, then is a horizontal line until 2 hours. the line moves quickly upward again until 6 hours, and then is horizontal until 7 hours a graph is shown with the axis labeled time (in hours) and the y-axis labeled total distance (in miles). the line begins at the y-axis where y equals 125. it is horizontal until 1.5 hours, then moves downward until 2 hours where it touches the x-axis. the line moves upward until 6 hours and then moves downward until 7 hours where it touches the x-axis a graph is shown with the axis labeled time (in hours) and the y-axis labeled total distance (in miles). the line begins at y equals 125 and is horizontal for 1.5 hours. the line moves downward until 2 hours, then back up until 5.5 hours. the line is horizontal from 5.5 to 7 hours
Answers: 1
You know the right answer?
Questions

English, 28.06.2021 14:20

Chemistry, 28.06.2021 14:20

Biology, 28.06.2021 14:20

Geography, 28.06.2021 14:20

Social Studies, 28.06.2021 14:20
Mathematics, 28.06.2021 14:20

English, 28.06.2021 14:20
Mathematics, 28.06.2021 14:20
English, 28.06.2021 14:20
Mathematics, 28.06.2021 14:20
Social Studies, 28.06.2021 14:20


