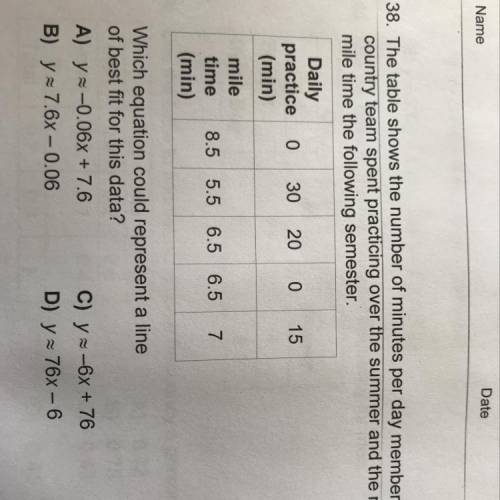
38. The table shows the number of minutes per day members of a cross
country team spent practi...

Mathematics, 05.05.2020 12:48 Har13526574
38. The table shows the number of minutes per day members of a cross
country team spent practicing over the summer and the members'
mile time the following semester.
Daily
practice
(min)
0
30
20
0
15
mile
time
(min)
8.5 5.5 6.5 6.5
7
Which equation could represent a line
of best fit for this data?
A) y=-0.06x + 7.6
C) y = -6x + 76
B) y=7.6x – 0.06 D) y=76x - 6


Answers: 1


Another question on Mathematics


Mathematics, 21.06.2019 19:00
The lengths of all sides of a triangle are integers when measured in decimeters. one of the sides has length of 1 dm and another of 3 dm. find the perimeter of the triangle.'
Answers: 1

Mathematics, 21.06.2019 20:10
Which ratios are equivalent to 10: 16? check all that apply. 30 to 48 25: 35 8: 32 5 to 15
Answers: 1

You know the right answer?
Questions

Biology, 10.11.2020 17:20


English, 10.11.2020 17:20


Business, 10.11.2020 17:20


Advanced Placement (AP), 10.11.2020 17:20

Chemistry, 10.11.2020 17:20


Mathematics, 10.11.2020 17:20


