
Mathematics, 05.05.2020 04:20 b2cutie456
You are given the sample mean and the population standard deviation. Use this information to construct the 90% and 95% confidence intervals for the population mean. Interpret the results and compare the widths of the confidence intervals. If convenient, use technology to construct the confidence intervals.
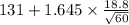
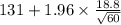
A random sample of 60 home theater systems has a mean price of$131.00. Assume the population standard deviation is$18.80.
Construct a 90% confidence interval for the population mean.
The 90% confidence interval is (,0
(Round to two decimal places as needed.)
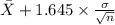
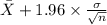
Construct a 95% confidence interval for the population mean.
The 95% confidence interval is(,)
(Round to two decimal places as needed.)
Interpret the results. Choose the correct answer below.
A.
With 90% confidence, it can be said that the population mean price lies in the first interval. With 95% confidence, it can be said that the population mean price lies in the second interval. The95% confidence interval is narrower than the 90%.
B.
With 90% confidence, it can be said that the population mean price lies in the first interval. With 95% confidence, it can be said that the population mean price lies in the second interval. The95% confidence interval is wider than the 90%.
C.
With 90% confidence, it can be said that the sample mean price lies in the first interval. With 95% confidence, it can be said that the sample mean price lies in the second interval. The 95% confidence interval is wider than the 90%

Answers: 2
 ~ N(0,1)
 = sample mean price = $131
 = population standard deviation = $18.80
 = population mean
 <
<  <
<  ) = 0.90
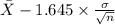 <
<  ) = 0.90
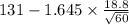 ,
,  ]
] <
<  ) = 0.95
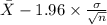 <
<  ) = 0.95
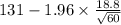 ,
,  ]
]

Another question on Mathematics
Mathematics, 21.06.2019 20:30
What is the volume of the cone to the nearest cubic millimeter? (use π = 3.14) a) 46 mm3 b) 128 mm3 c) 183 mm3 d) 275 mm3 diameter = 5 mm height = 7 mm how do you do this problem step by step?
Answers: 1
Mathematics, 21.06.2019 22:00
Which of the following is an example of conditional probability
Answers: 3
Mathematics, 21.06.2019 22:00
Which of the following graphs could represent a cubic function?
Answers: 1
You know the right answer?
You are given the sample mean and the population standard deviation. Use this information to constru...
Questions

English, 27.10.2020 22:00
Mathematics, 27.10.2020 22:10
Mathematics, 27.10.2020 22:10
Mathematics, 27.10.2020 22:10
Mathematics, 27.10.2020 22:10

Computers and Technology, 27.10.2020 22:10
Mathematics, 27.10.2020 22:10
Mathematics, 27.10.2020 22:10

Geography, 27.10.2020 22:10
Mathematics, 27.10.2020 22:10

Biology, 27.10.2020 22:10
Mathematics, 27.10.2020 22:10

Mathematics, 27.10.2020 22:10


