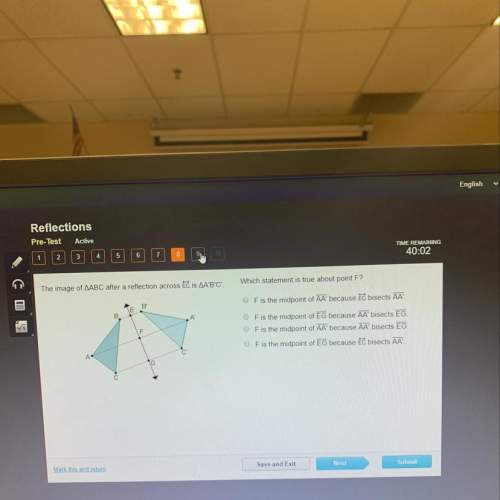
Select the correct answer.
Number of Cars Sold over 10 Years
1000
Car Prices
...

Mathematics, 18.04.2020 06:19 nmartin1467
Select the correct answer.
Number of Cars Sold over 10 Years
1000
Car Prices
A car salesman sells cars with prices ranging from $5,000 to $45,000. The histogram shows the distribution of the numbers of cars he expects to
sell over the next
10 years.
The salesman has observed that many students are looking for cars that cost less
than $5.000. If he decides to also deal in cars that cost less than $5,000 and projects selling 200 of them over the next 10 years. how will the
distribution be affected?
A.
The mean will shift to the right.
The mean and the median will be the same.
B.
C.
D.
The median will shift to the right.
The mean will shift to the left.
Plz guys I need help

Answers: 1


Another question on Mathematics
Mathematics, 21.06.2019 15:40
The data represents the semester exam scores of 8 students in a math course. {51,91,46,30,36,50,73,80} what is the five-number summary?
Answers: 1
Mathematics, 22.06.2019 00:40
Can you divide 25 into 4 equal groups? explain why or why not.
Answers: 1
Mathematics, 22.06.2019 02:30
Chosen according to the volume of oil it can haul, as shown in at a railway yard, locomotives are used to haul containers carrying the table. locomotive capacity a450 0 -750 cubic feet cg35 750-1,500 cubic feet br73 1,500-2,500 cubic feet yh61 2,500-3,500 cubic feet & the four cylindrical containers listed in the table need to be hauled. cylinder length (ft.) diameter (ft.) fill level a 40 , 12 half b 24 8 full c 16 16 full 6 12 full d match each container to the locomotive needed to haulit a450 cylinder a yh61 cylinder d
Answers: 2
You know the right answer?
Questions


Biology, 19.05.2020 18:02
Mathematics, 19.05.2020 18:02


Chemistry, 19.05.2020 18:02

Mathematics, 19.05.2020 18:02
Mathematics, 19.05.2020 18:02
Mathematics, 19.05.2020 18:02
Mathematics, 19.05.2020 18:02

English, 19.05.2020 18:02


