Look at the graph below.
A graph is shown with Absolute magnitude shown on y axis and Su...

Mathematics, 16.04.2020 05:35 DEEWILL5100
Look at the graph below.
A graph is shown with Absolute magnitude shown on y axis and Surface temperature in degree Celsius shown on x axis. The Dwarf stars are shown along a slanting line from coordinates 30,000 and minus 3 to 10,000 and minus 4. The Main Sequence stars are shown along a slanting line from coordinates 20,000 and minus 2 to 2,000 and minus 6. The giants are shown along a line parallel to the x axis from coordinates 5,000 and 2 to 2,000 and 3. The supergiants are shown along a line parallel to the x axis from coordinates 7,500 and 4 to 2,500 and 4. Point A has coordinates 20,000 and minus 4. Point B has coordinates 2,500 and minus 4. Point C has coordinates 5,000 and 2. Point D has coordinates 7,000 and 4.
Which of the following stars is most likely to be red?
Star A
Star B
Star C
Star D

Answers: 1


Another question on Mathematics
Mathematics, 21.06.2019 23:30
Written as a simplified polynomial in standard form, what is the result when (2x+8)^2(2x+8) 2 is subtracted from 8x^2-38x 2 −3?
Answers: 3
Mathematics, 22.06.2019 02:00
Pleasseee important quick note: enter your answer and show all the steps that you use to solve this problem in the space provided. use the circle graph shown below to answer the question. a pie chart labeled favorite sports to watch is divided into three portions. football represents 42 percent, baseball represents 33 percent, and soccer represents 25 percent. if 210 people said football was their favorite sport to watch, how many people were surveyed?
Answers: 1
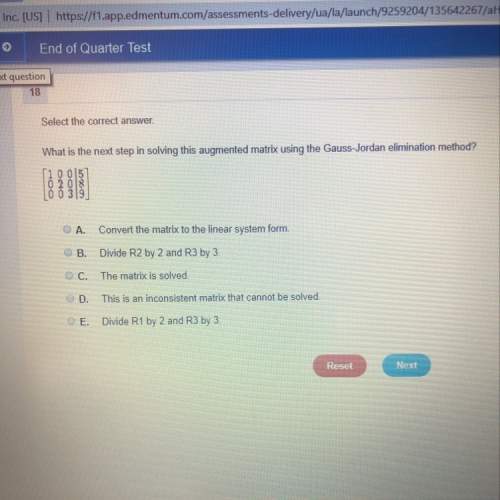
Mathematics, 22.06.2019 02:30
The graph shows the amount of total rainfall at each hour what was the total rainfall amount after three hours
Answers: 1
You know the right answer?
Questions


Mathematics, 11.02.2020 20:20


