(this question is for image number 2)
1.The following dot plot represents a random sampl...

Mathematics, 15.04.2020 17:26 darrengresham999
(this question is for image number 2)
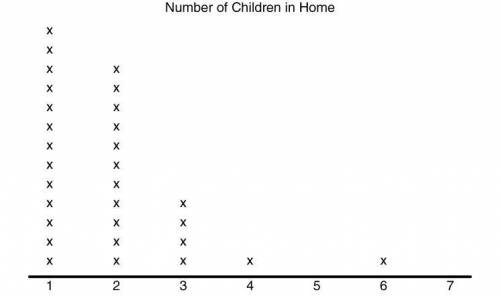
1.The following dot plot represents a random sample of elementary students and the number of children that live in their home.
Part 1: What is the range of the data set?
Part 2: What is the interquartile range of the data set?
Part 3: What is the mean absolute deviation of the data set? [Round both the mean and the mean absolute deviation to the nearest tenth.]
2.The following dot plot represents a random sample of elementary students and the number of children that live in their home.
Calculate the measures of central tendency for this set of data. Which of the following statements is NOT true?
a. The mean is closer in value to the mode than to the median.
b. The median is the largest measure of central tendency.
c. The median is greater than the mode.
d. The mode is less than the mean.
(questions for image 1)
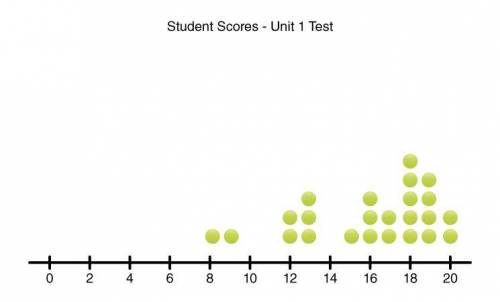
1.The following dot plot represents student scores on the Unit 1 math test. Scores are in whole number increments. If the test was out of 20 points, about what percentage of the students scored at least 80% on the test?
a.48%
b.67%
c.17%
d.12%
2.The following dot plot represents student scores on the Unit 1 math test. Scores are in whole number increments.
Part 1: What is the mean score, rounded to the nearest whole number?
Part 2: What is the median score?
Part 3: What is the mode score?
3.The following dot plot represents student scores on the Unit 1 math test. Scores are in whole number increments.
For this data set, the value of the range is about(CHOOSE: the same as or triple, or twice) the value of the interquartile range.
On average, the data points lie between(CHOOSE: 3 and 4 or 5 and 6 or 1 and 2 or 2 and 3 or 4 and 5) points from the mean.
HELP MEH ASAP

Answers: 1


Another question on Mathematics
Mathematics, 21.06.2019 19:30
Use multiples to write two fractions equivalent to 7/9. 14/18, 8/10 6/8, 21/27 10/12, 28/36 14/18, 21/27
Answers: 1
Mathematics, 22.06.2019 02:20
If you draw a card with a value of three or less from a standard deck of cards, i will pay you $43. if not, you pay me $11. (aces are considered the highest card in the deck.) step 1 of 2 : find the expected value of the proposition. round your answer to two decimal places. losses must be expressed as negative values.
Answers: 2
Mathematics, 22.06.2019 04:20
Dana kicks a soccer ball. the table shows the height of the soccer ball with respect to the time, in seconds, after the ball was kicked.time | height(seconds) | (feet) ~~~~~~~~~~~~~~~0.5 211 341.5 392 362.5 253 6which graph best displays the relationship shown in the table? (i just need confirmation that its c)
Answers: 2
You know the right answer?
Questions

Mathematics, 18.06.2020 19:57

Mathematics, 18.06.2020 19:57

Physics, 18.06.2020 19:57
Mathematics, 18.06.2020 19:57

Biology, 18.06.2020 19:57
History, 18.06.2020 19:57

Mathematics, 18.06.2020 19:57
Mathematics, 18.06.2020 19:57

Chemistry, 18.06.2020 19:57

Mathematics, 18.06.2020 19:57


