
Mathematics, 07.04.2020 19:30 sierravick123owr441
Consider the following set of processes, with the length of the CPU burst given in milliseconds:
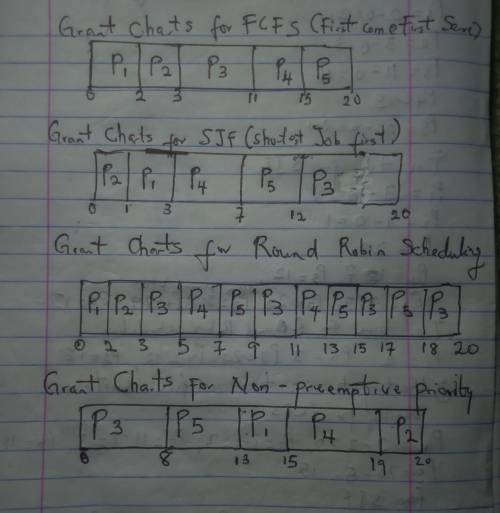
Process Burst Time Priority
P1 2 2
P2 1 1
P3 8 4
P4 4 2
P5 5 3
The processes are assumed to have arrived in the order P1, P2, P3, P4, P5, all at time 0.
a. Draw four Gantt charts that illustrate the execution of these processes using the following scheduling algorithms: FCFS, SJF, nonpreemptive priority (a larger priority number implies a higher priority), and RR (quantum - 2)
b. What is the turnaround time of each process for each of the scheduling algorithms in part a?
c. What is the waiting time of each process for each of these scheduling algorithms?
d. Which of the algorithms results in the minimum average waiting time (over all processes)?

Answers: 1


Another question on Mathematics
Mathematics, 21.06.2019 15:00
2x + 1 < 5 solve the following inequality. then place the correct number in the box provided.
Answers: 2
Mathematics, 21.06.2019 15:00
Martha needs 22.25 strawberries for every 5 smoothies she makes. complete the table to see how many strawberries she would need to make 10 smoothies and 20 smoothies.
Answers: 1
Mathematics, 21.06.2019 15:30
With these: 18/36 = 1/? missing number change 1 5/8 to improper fraction. change 19/5 to a mixed number.
Answers: 3
Mathematics, 21.06.2019 16:00
Part one: measurements 1. measure your own height and arm span (from finger-tip to finger-tip) in inches. you will likely need some from a parent, guardian, or sibling to get accurate measurements. record your measurements on the "data record" document. use the "data record" to you complete part two of this project. name relationship to student x height in inches y arm span in inches archie dad 72 72 ginelle mom 65 66 sarah sister 64 65 meleah sister 66 3/4 67 rachel sister 53 1/2 53 emily auntie 66 1/2 66 hannah myself 66 1/2 69 part two: representation of data with plots 1. using graphing software of your choice, create a scatter plot of your data. predict the line of best fit, and sketch it on your graph. part three: the line of best fit include your scatter plot and the answers to the following questions in your word processing document 1. 1. which variable did you plot on the x-axis, and which variable did you plot on the y-axis? explain why you assigned the variables in that way. 2. write the equation of the line of best fit using the slope-intercept formula $y = mx + b$. show all your work, including the points used to determine the slope and how the equation was determined. 3. what does the slope of the line represent within the context of your graph? what does the y-intercept represent? 5. use the line of best fit to you to describe the data correlation.
Answers: 2
You know the right answer?
Consider the following set of processes, with the length of the CPU burst given in milliseconds:
Questions
Mathematics, 31.01.2020 03:03


Biology, 31.01.2020 03:03


Business, 31.01.2020 03:03
Mathematics, 31.01.2020 03:03
History, 31.01.2020 03:03
Mathematics, 31.01.2020 03:03

English, 31.01.2020 03:03
History, 31.01.2020 03:03
Mathematics, 31.01.2020 03:03


