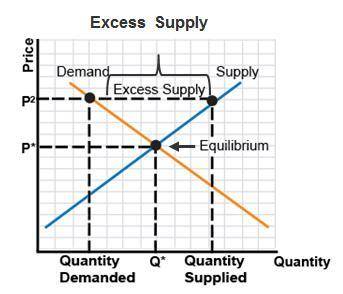
The graph shows excess supply.
A graph titled Excess supply has quantity on the x-axis a...

Mathematics, 02.04.2020 23:40 jasmine2919
The graph shows excess supply.
A graph titled Excess supply has quantity on the x-axis and price on the y-axis. A line with positive slope represents supply and a line with negative slope represents demand. The lines intersect at the point of equilibrium (p star, Q star). A point on the demand line is (P 2, quantity demanded) and a point on the supply line is (P 2, quantity supplied). Both points are higher than the point of equilibrium. Excess supply is indicated between the 2 points.
Which needs to happen to the price indicated by p2 on the graph in order to achieve equilibrium?
It needs to be increased.
It needs to be decreased.
It needs to reach the price ceiling.
It needs to remain unchanged.

Answers: 1


Another question on Mathematics
Mathematics, 21.06.2019 20:30
Venita is sewing new curtains. the table below shows the relationship between the number of stitches in a row and the length ofthe row.sewingnumber of stitches length (cm)51 131532024306what is the relationship between the number of stitches and the length? othe number of stitches istimes the length.o. the number of stitches is 3 times the length.
Answers: 2
Mathematics, 21.06.2019 21:10
Jenny earned a 77 on her most recent test jenny score is no less then 5 points greater then 4/5 of terrance’s score if t represents terrance score which inequality represents the situation
Answers: 3
Mathematics, 22.06.2019 00:00
Ascientist studied a population of workers to determine whether verbal praise and/or tangible rewards affect employee productivity. in the study, some workers were offered verbal praise, some were offered tangible rewards (gift cards, presents, and some were offered neither. the productivity of each participant was measured throughout the study by recording the number of daily tasks completed by each employee. which inference might the scientists make based on the given information? a.) the number of daily tasks completed by each employee may influence the dependent variable, which is whether the employee receives verbal praise, tangible rewards, or neither. b.) verbal praise and/or tangible rewards may influence the independent variable, which is the number of daily tasks completed by each employee. c.) verbal praise and/or tangible rewards may influence the dependent variable, which is the number of daily tasks completed by each employee. d.) the dependent variables, which are verbal praise and tangible rewards, may influence the number of daily tasks completed by each employee.
Answers: 1
Mathematics, 22.06.2019 00:30
Measure a and b and find their sum. how are the angles related?
Answers: 3
You know the right answer?
Questions


English, 20.08.2020 01:01
Mathematics, 20.08.2020 01:01

Mathematics, 20.08.2020 01:01


