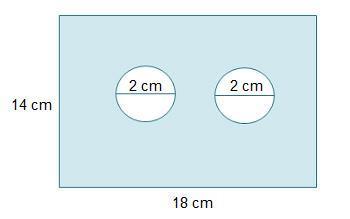
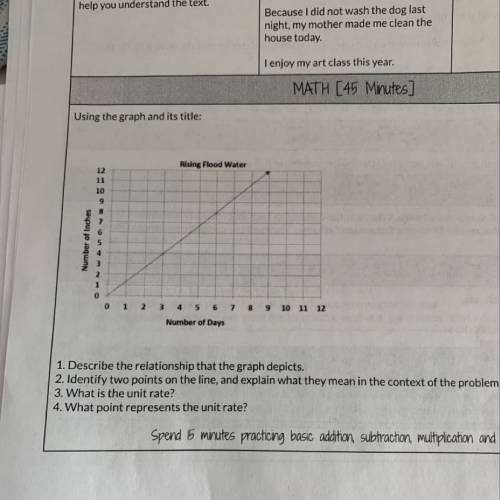
Using the graph and its title: Rising Flood Water Number of inches ONWAR 0 1 2 7 8 9 10 11 12 3 4 5 6 Number of Days 1. Describe the relationship that the graph depicts. 2. Identify two points on the line, and explain what they mean in the context of the problem. 3. What is the unit rate? 4. What point represents the unit rate? Inicion Foot