
Mathematics, 31.03.2020 00:17 tai1611
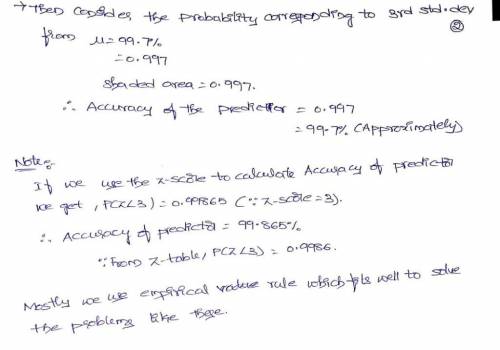
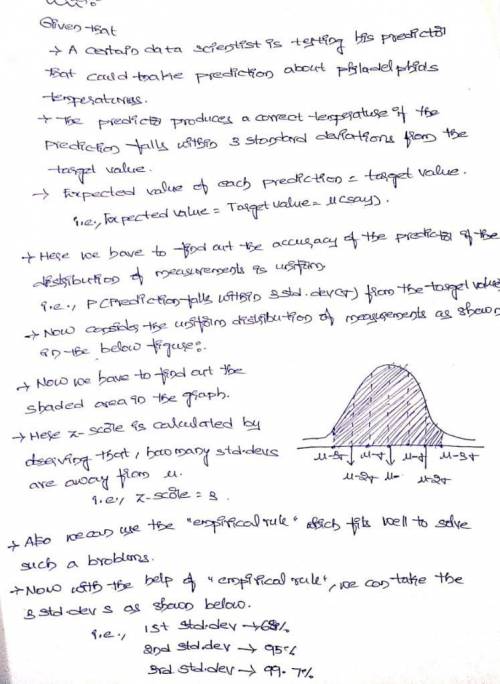
A certain data scientist is testing his predictor (essentially a tool given historical data and would make predictions using said data) that would make predictions about Philadelphia’s temperatures. The predictor produces a correct temperature if the prediction falls within three standard deviations from the target value. Assume that the expected value of each prediction equals the target value.
What is the accuracy of the predictor if the distribution of measurements is uniform?

Answers: 2


Another question on Mathematics
Mathematics, 22.06.2019 00:30
Julie multiplies 6.27 by 7 and claims the product is 438.9 .explain without multiplying how you know juliesanswer is not correct.find the correct answer
Answers: 1
Mathematics, 22.06.2019 02:30
Atrain traveled for 1.5 hours to the first station, stopped for 30 minutes, then traveled for 4 hours to the final station where it stopped for 1 hour. the total distance traveled is a function of time. which graph most accurately represents this scenario? a graph is shown with the x-axis labeled time (in hours) and the y-axis labeled total distance (in miles). the line begins at the origin and moves upward for 1.5 hours. the line then continues upward at a slow rate until 2 hours. from 2 to 6 hours, the line continues quickly upward. from 6 to 7 hours, it moves downward until it touches the x-axis a graph is shown with the axis labeled time (in hours) and the y axis labeled total distance (in miles). a line is shown beginning at the origin. the line moves upward until 1.5 hours, then is a horizontal line until 2 hours. the line moves quickly upward again until 6 hours, and then is horizontal until 7 hours a graph is shown with the axis labeled time (in hours) and the y-axis labeled total distance (in miles). the line begins at the y-axis where y equals 125. it is horizontal until 1.5 hours, then moves downward until 2 hours where it touches the x-axis. the line moves upward until 6 hours and then moves downward until 7 hours where it touches the x-axis a graph is shown with the axis labeled time (in hours) and the y-axis labeled total distance (in miles). the line begins at y equals 125 and is horizontal for 1.5 hours. the line moves downward until 2 hours, then back up until 5.5 hours. the line is horizontal from 5.5 to 7 hours
Answers: 1
You know the right answer?
A certain data scientist is testing his predictor (essentially a tool given historical data and woul...
Questions

Spanish, 08.07.2019 07:50

English, 08.07.2019 07:50
Mathematics, 08.07.2019 07:50
Mathematics, 08.07.2019 07:50
Mathematics, 08.07.2019 07:50

Biology, 08.07.2019 07:50


Social Studies, 08.07.2019 07:50
Mathematics, 08.07.2019 07:50
Biology, 08.07.2019 07:50

History, 08.07.2019 07:50
Mathematics, 08.07.2019 07:50
Mathematics, 08.07.2019 07:50
Biology, 08.07.2019 07:50


