Question 1(Multiple Choice Worth 5 points)
(08.05A LC)
Which line best repre...

Mathematics, 30.03.2020 17:27 lifehitsjackson
Question 1(Multiple Choice Worth 5 points)
(08.05A LC)
Which line best represents the line of best fit for this scatter plot?
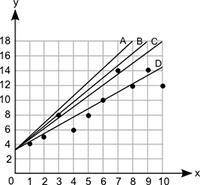
Graph shows numbers from 0 to 10 at increments of 1 on the x axis and numbers from 0 to 18 at increments of 2. Scatter plot shows ordered pairs 1, 4 and 2, 5 and 3, 8 and 4, 6 and 5, 8 and 6, 10 and 7, 14 and 8, 12 and 9, 14 and 10, 12. A line labeled A joins ordered pair 0, 3.2 and 8, 18. A line labeled B joins ordered pairs 0, 3.2 and 9, 18. A line labeled C joins ordered pairs 0, 3.2 and 10, 18. A line labeled D joins ordered pairs 0, 3.2 and 10, 14.2.
Line A
Line B
Line C
Line D
Question 2(Multiple Choice Worth 5 points)
(08.05A MC)
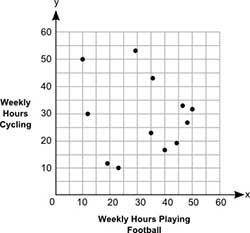
A group of students plotted the number of hours they spent cycling and the number of hours they spent playing football in a week.
Graph shows 0 to 60 on x axis and y axes at increments of 10. The label on the x axis is Weekly Hours Playing Football, and the label on the y axis is Weekly Hours Cycling. Dots are made at the ordered pairs 10, 50 and 12, 30 and 19, 12 and 23, 10 and 29, 53 and 35, 23 and 36, 43 and 40, 17 and 44, 19 and 47, 33 and 48, 27 and 50, 32.
Which statement best describes the relationship between the number of hours spent cycling and the number of hours spent playing football?
Fewer hours cycled, fewer hours spent playing football
Greater hours cycled, greater hours spent playing football
Fewer hours cycled, greater hours spent playing football
There is no relationship between hours spent cycling and hours spent playing football.
Question 3(Multiple Choice Worth 5 points)
(08.05A MC)
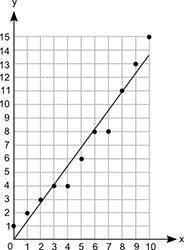
A scatter plot with a line is shown below.
Graph shows numbers from 0 to 10 at increments of 1 on the x axis and numbers from 0 to 15 at increments of 1 on the y axis. Scatter plot shows ordered pairs 0, 1 and 1, 2 and 2, 3 and 3,4 and 4, 4 and 5, 6 and 6, 8 and 7, 8 and 8, 11 and 9, 13 and 10, 15. A line joins ordered pairs 0, 0 and 10, 13.6.
Which statement is most likely correct about the line?
It can be the line of best fit because it is closest to most data points.
It can be the line of best fit because it passes through all the scatter points.
It cannot be the line of best fit because it does not pass through all the points.
It cannot be the line of best fit because it does not pass through the first and last points.
Question 4(Multiple Choice Worth 5 points)
(08.05A LC)
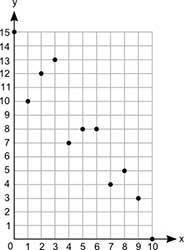
A scatter plot is shown below:
A graph shows numbers from 0 to 10 on the x axis at increments of 1 and the numbers 0 to 15 on the y axis at increments of 1. The ordered pairs 0, 15 and 1, 10 and 2, 12 and 3, 13 and 4, 7 and 5, 8 and 6, 8 and 7, 4 and 8, 5 and 9, 3 and 10, 0 are shown on the graph.
Which two ordered pairs can be joined to best draw the line of best fit for this scatter plot?
(0, 14) and (10, 14)
(0, 14) and (10, 1)
(0, 7) and (7, 0)
(0, 7) and (3, 0)

Answers: 2


Another question on Mathematics
Mathematics, 21.06.2019 19:00
What is the percentile for data value 6 in the following data set? 4 13 8 6 4 4 13 6 4 13 2 13 15 5 9 4 12 8 6 13 40 25 35 62
Answers: 2
Mathematics, 21.06.2019 19:30
Me max recorded the heights of 500 male humans. he found that the heights were normally distributed around a mean of 177 centimeters. which statements about max’s data must be true? a) the median of max’s data is 250 b) more than half of the data points max recorded were 177 centimeters. c) a data point chosen at random is as likely to be above the mean as it is to be below the mean. d) every height within three standard deviations of the mean is equally likely to be chosen if a data point is selected at random.
Answers: 2
Mathematics, 21.06.2019 19:30
Which of the following describes the symmetry of the graph of y = x3?
Answers: 2
You know the right answer?
Questions


Computers and Technology, 02.08.2021 22:00


Health, 02.08.2021 22:00
Mathematics, 02.08.2021 22:00
Mathematics, 02.08.2021 22:00
Mathematics, 02.08.2021 22:00


