![r=\frac{n(\sum xy)-(\sum x)(\sum y)}{\sqrt{[n\sum x^2 -(\sum x)^2][n\sum y^2 -(\sum y)^2]}}](/tpl/images/0541/2302/ec454.png)

![r=\frac{10(330.0321)-(75.81948)(43.5231)}{\sqrt{[10(574.8598) -(75.819)^2][10(192.8274) -(43.5231)^2]}}=0.989](/tpl/images/0541/2302/c7336.png)
![r=\frac{10(330.0321)-(75.81948)(43.5231)}{\sqrt{[10(574.8598) -(75.81948)^2][10(192.8274) -(43.5231)^2]}}=0.989](/tpl/images/0541/2302/07d17.png)
The number of motor vehicles registered in millions in the US has grown as follows:
Year...

Mathematics, 10.03.2020 18:56 tysongraham5232
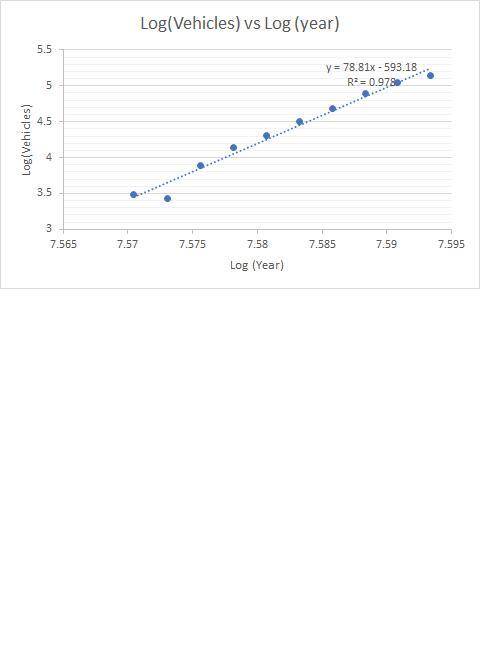
The number of motor vehicles registered in millions in the US has grown as follows:
Year: 1940, 1945 1950, 1955, 1960, 1965, 1970, 1975, 1980, 1985
Vehicles: 32.4, 31.0, 49.2, 62.7, 73.9, 90.4, 108.4, 132.9, 155.8, 171.7
(Where Year = X and Vehicles = Y)
Use logarithms to transform the data into a linear association. White the equation of the LSRL. Your answer should have logs in it. Remember to define any variables.
a. Present a scatter plot for the data. (Hint: let x = 0 represent the year 1940)
b. Determine the correlation coefficient for the data and interpret the value.

Answers: 3


Another question on Mathematics
Mathematics, 21.06.2019 12:30
Giving ad is congruent to bc and angle bcd is congruent to angle adc prove d e is going to ce
Answers: 3
Mathematics, 21.06.2019 12:50
What is the pattern in the values as the exponents increase?
Answers: 1
Mathematics, 21.06.2019 13:20
In an experiment you are to flip a two sided coin 100 times and record 55 heads up and 45 tails up determine the theoretical and experimental probability of getting a heads up in the experiment.
Answers: 3
Mathematics, 21.06.2019 13:30
David bought a poster for an art project. the poster is 2.7 feet wide and 3.9 feet tall. what is the area of the poster?
Answers: 2
You know the right answer?
Questions


History, 16.10.2020 19:01


Chemistry, 16.10.2020 19:01

Spanish, 16.10.2020 19:01
English, 16.10.2020 19:01
Mathematics, 16.10.2020 19:01
History, 16.10.2020 19:01

Biology, 16.10.2020 19:01
Mathematics, 16.10.2020 19:01

Computers and Technology, 16.10.2020 19:01

Geography, 16.10.2020 19:01
Mathematics, 16.10.2020 19:01


