Please help i will give brainliest
The following dot plots represent the scores on the...

Mathematics, 29.02.2020 00:53 math4863
Please help i will give brainliest
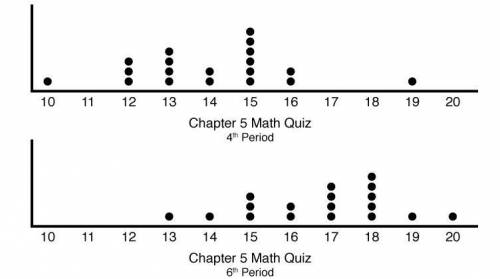
The following dot plots represent the scores on the Chapter 5 quiz for Mrs. Chin's 4th and 6th period classes.
Calculate the mean and mean absolute deviation (rounded to the nearest tenth) for both classes.
Use your answer calculations from part A to answer all of the following questions: Which class period, on average, scored better on the quiz? By how much did they score better? How does the difference between the mean scores compare to the mean absolute deviation? Is there much overlap in the data? Write your answers in complete sentences.

Answers: 1


Another question on Mathematics
Mathematics, 21.06.2019 21:50
Which of the following is the graph of y= square root -x-3
Answers: 1
Mathematics, 21.06.2019 22:00
Select the correct answer from each drop-down menu. consider the following polynomials equations. 3x^2(x-1) and -3x^3+ 4x^2-2x+1 perform each operation and determine if the result is a polynomial. is the result of a + b a polynomial? yes or no is the result of a - b a polynomial? yes or no is the result of a · b a polynomial? yes or no
Answers: 1
You know the right answer?
Questions

Advanced Placement (AP), 05.10.2021 14:00


Business, 05.10.2021 14:00


Chemistry, 05.10.2021 14:00
Mathematics, 05.10.2021 14:00

Mathematics, 05.10.2021 14:00
Mathematics, 05.10.2021 14:00

Biology, 05.10.2021 14:00
Business, 05.10.2021 14:00
History, 05.10.2021 14:00
Mathematics, 05.10.2021 14:00


