
Mathematics, 21.02.2020 03:40 liluv5062
According to the 2018 General Social Survey (GSS), 60% of all U. S. households have at least one pet. A veterinarian in Ann Arbor decided to conduct a survey to assess if over 60% of all Ann Arbor households have at least one pet. A 10% significance level was selected to be used. The random sample of 280 Ann Arbor households, resulted in 182 stating they currently have at least one pet. These results are turned over to you to perform the appropriate test. 1) State the appropriate hypotheses to be tested with a complete definition of the parameter of interest. (the significance level has been selected to be 10%). 2) Check the necessary assumption(s) (you may assume that the selected sample is a random sample). 3) Perform the appropriate test (include all supporting computations for the test statistic and p-value) 4) Give your decision and provide a conclusion in context. Your answer needs to be organized well and use labels for your Steps 1, 2, 3, and 4.

Answers: 2


 (1)
(1)  ,
,  so then the normal approximation makes sense
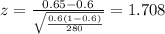
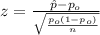
 . The next step would be calculate the p value for this test.
 so we can conclude that we have enough evidence to reject the null hypothesis, and we can said that at 10% of significance the proportion of households with at least one pet is significantly higher than 0.6 or 60%.
 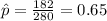 estimated proportion of households with at least one pet
 is the value that we want to test
 represent the p value (variable of interest)
  is significantly different from a hypothesized value
  .
.


Another question on Mathematics
Mathematics, 21.06.2019 17:50
F(x) = x2 − 9, and g(x) = x − 3 f(x) = x2 − 4x + 3, and g(x) = x − 3 f(x) = x2 + 4x − 5, and g(x) = x − 1 f(x) = x2 − 16, and g(x) = x − 4 h(x) = x + 5 arrowright h(x) = x + 3 arrowright h(x) = x + 4 arrowright h(x) = x − 1 arrowright
Answers: 2
Mathematics, 21.06.2019 18:00
What is the equation of this graphed line? enter your answer in slope-intercept form in the box.
Answers: 2
Mathematics, 22.06.2019 01:00
5. write an equation for the line that is parallel to the given line and that passes through the given point. y = –5x + 3; (–6, 3)
Answers: 2
You know the right answer?
According to the 2018 General Social Survey (GSS), 60% of all U. S. households have at least one pet...
Questions


Mathematics, 05.05.2020 17:11
Biology, 05.05.2020 17:11


