
Mathematics, 12.02.2020 06:29 Thiskid100
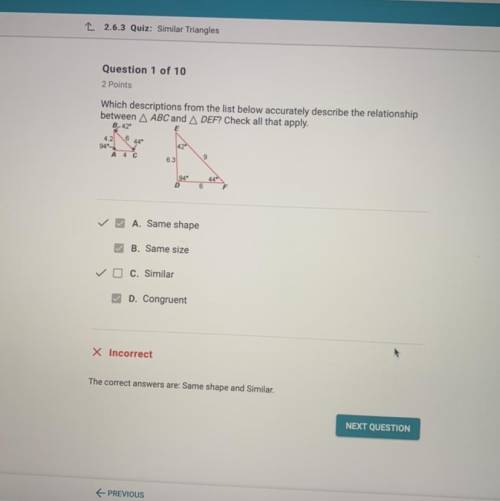
Which description from the list below accurately describe the relationship between ABC and DEF ? Check all that apply.
Answer is : Same shape and similar!

Answers: 1


Another question on Mathematics
Mathematics, 21.06.2019 20:30
I’m on question 7 it says a covered water tank is in the shape of a cylinder the tank has a 28 inch diameter and a height of 66 inches to the nearest square inch what is the surface area of the water tank
Answers: 2
Mathematics, 21.06.2019 21:20
Christine wong has asked dave and mike to her move into a new apartment on sunday morning. she has asked them both, in case one of them does not show up. from past experience, christine knows that there is a 40% chance that dave will not show up and a 30% chance that mik a. what is the probability that both dave and mike will show up? (round your answer to 2 decimal places.) b. what is the probability that at least one of them will show up? c. what is the probability that neither dave nor mike will show up? (round your answer to 2 decimal places.)e will not show up. dave and mike do not know each other and their decisions can be assumed to be independent.
Answers: 2
Mathematics, 21.06.2019 23:30
Bonnie and bobby are saving money for a vacation. each friend starts with an amount and also saves a specific amount each week. bonnie created a table to show the total she has saved at the end of each week.. weeks 0 1 2 3 4 5 6 7 8 amount saved 12 16 20 24 28 32 36 40 44 bobby came up with the following equation to show the total, y, he has saved at the end of each week, x. y = 12x + 4 compare the rate at which each friend saves money. select the correct answer from the drop-down menu to complete the statement. the rate at which bobby is adding to his savings each week is $ more than the rate at which bonnie is adding to her savings each week.
Answers: 2
Mathematics, 22.06.2019 01:30
Asample of 200 rom computer chips was selected on each of 30 consecutive days, and the number of nonconforming chips on each day was as follows: the data has been given so that it can be copied into r as a vector. non.conforming = c(10, 15, 21, 19, 34, 16, 5, 24, 8, 21, 32, 14, 14, 19, 18, 20, 12, 23, 10, 19, 20, 18, 13, 26, 33, 14, 12, 21, 12, 27) #construct a p chart by using the following code. you will need to enter your values for pbar, lcl and ucl. pbar = lcl = ucl = plot(non.conforming/200, ylim = c(0,.5)) abline(h = pbar, lty = 2) abline(h = lcl, lty = 3) abline(h = ucl, lty = 3)
Answers: 3
You know the right answer?
Which description from the list below accurately describe the relationship between ABC and DEF ? Che...
Questions


Chemistry, 04.06.2021 14:00

English, 04.06.2021 14:00

Social Studies, 04.06.2021 14:00

Mathematics, 04.06.2021 14:00

English, 04.06.2021 14:00
English, 04.06.2021 14:00

Mathematics, 04.06.2021 14:00
Mathematics, 04.06.2021 14:00
Mathematics, 04.06.2021 14:00


