
Mathematics, 22.01.2020 19:31 rtorres3
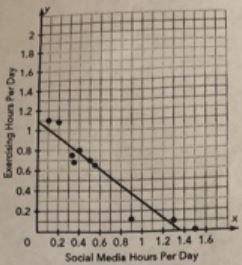
The graph shows the number of hours per day spent on social media by a group of teenagers and the number of hours per day spent exercising. a line of best fit for the data is shown.
a scatterplot is shown in the xy-plane. the horizontal axis is labeled as social media hours per day and the vertical axis is labeled as exercising hours per day. the values on the horizontal axis range from 0 to 1.6 in increments of 0.2 and the values on the y-axis range from 0 to 2 in increments of 0.2. the line of best fit intersects the x-axis at a point just to the left of 1 decimal point 4 and y-axis at a point just below 1.1. majority of the data points are concentrated between 0.3 and 0.6 on the horizontal axis and 0.6 and 0.9 on the vertical axis and two points are marked on the line.
use the graph to determine how many hours a teenager would spend exercising in one day if they spent 0.25 hours on social media.
use the graph to determine how many hours a teenager would spend exercising in one day if they spent 1.38 hours on social media.
do you think the predictions from part (a) and part (b) are reliable? explain your reasoning.

Answers: 3


Another question on Mathematics
Mathematics, 21.06.2019 14:30
Select the correct answer. what is the surface area of the victory podium shown here? include all surfaces of the podium, including the bottom. a. 61.5 square feet b. 61.75 square feet c. 65.25 square feet d. 69 square feet
Answers: 2
Mathematics, 21.06.2019 16:00
Apark is in the shape of a rectangle. the park authorities are planning to build a 2-meter-wide jogging path in the park (shown as the shaded region in the image). what is the area of the jogging path? plz
Answers: 1
Mathematics, 21.06.2019 23:30
(c) compare the results of parts (a) and (b). in general, how do you think the mode, median, and mean are affected when each data value in a set is multiplied by the same constant? multiplying each data value by the same constant c results in the mode, median, and mean increasing by a factor of c. multiplying each data value by the same constant c results in the mode, median, and mean remaining the same. multiplying each data value by the same constant c results in the mode, median, and mean decreasing by a factor of c. there is no distinct pattern when each data value is multiplied by the same constant. (d) suppose you have information about average heights of a random sample of airline passengers. the mode is 65 inches, the median is 72 inches, and the mean is 65 inches. to convert the data into centimeters, multiply each data value by 2.54. what are the values of the mode, median, and mean in centimeters? (enter your answers to two decimal places.) mode cm median cm mean cm in this problem, we explore the effect on the mean, median, and mode of multiplying each data value by the same number. consider the following data set 7, 7, 8, 11, 15. (a) compute the mode, median, and mean. (enter your answers to one (1) decimal places.) mean value = median = mode = (b) multiply 3 to each of the data values. compute the mode, median, and mean. (enter your answers to one (1) decimal places.) mean value = median = mode = --
Answers: 1
You know the right answer?
The graph shows the number of hours per day spent on social media by a group of teenagers and the nu...
Questions
Mathematics, 20.07.2019 17:30


Health, 20.07.2019 17:30

Biology, 20.07.2019 17:30
Mathematics, 20.07.2019 17:30

Biology, 20.07.2019 17:30
Health, 20.07.2019 17:30
History, 20.07.2019 17:30

Business, 20.07.2019 17:30

Chemistry, 20.07.2019 17:30
Mathematics, 20.07.2019 17:30

Spanish, 20.07.2019 17:30
Mathematics, 20.07.2019 17:30


