


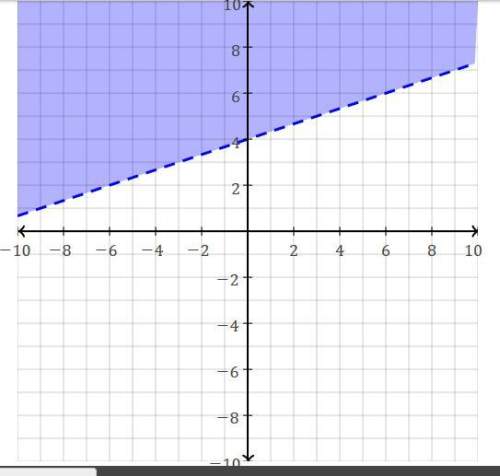
Which inequality does the given graph represent?
a) y > 3x + 4
b) y > 1/3x − 4...

Mathematics, 18.12.2019 01:31 mari530
Which inequality does the given graph represent?
a) y > 3x + 4
b) y > 1/3x − 4
c) y > 1/3x + 4
d) y ≥ 1/3x + 4

Answers: 1


Another question on Mathematics
Mathematics, 21.06.2019 21:00
Glenda makes an online purchase for picture frames for $12.95 each and formats of $5.89 each the site says it taxes paid by the customer or 6.5% of the total purchase price shipping charges are based on the
Answers: 1
Mathematics, 22.06.2019 03:00
Monthly water bills for a city have a mean of $108.43 and a standard deviation of $36.98. find the probability that a randomly selected bill will have an amount greater than $173, which the city believes might indicate that someone is wasting water. would a bill that size be considered unusual?
Answers: 3
Mathematics, 22.06.2019 03:30
Asoftball team played ten games, scoring 1, 2, 3, 4, 5, 6, 7, 8, 9, and 10 runs. they lost by one run in exactly five games. in each of their other games, they scored twice as many runs as their opponent. how many total runs did their opponents score?
Answers: 1
You know the right answer?
Questions

Social Studies, 06.04.2020 23:14


Biology, 06.04.2020 23:14


Mathematics, 06.04.2020 23:14


Spanish, 06.04.2020 23:14
Biology, 06.04.2020 23:14

History, 06.04.2020 23:14

English, 06.04.2020 23:14
Mathematics, 06.04.2020 23:15
Mathematics, 06.04.2020 23:15

Computers and Technology, 06.04.2020 23:15


