
Mathematics, 16.12.2019 20:31 hargunk329
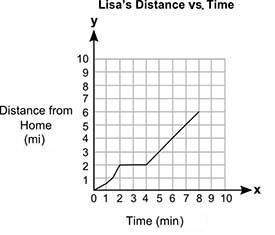
The graph below shows lisa's distance from her home (y), in miles, after a certain amount of time (x), in minutes: graph titled lisas distance vs time shows 0 to 10 on x and y axes at increments of 1. the label on x axis is time in minutes and that on y axis is distance from home in miles. lines are joined at the ordered pairs 0, 0 and 1, 0.5 and 1.5, 1 and 2, 2 and 3, 2 and 4, 2 and 5, 3 and 6, 4 and 7, 5 and 8, 6. four students described lisa's motion, as shown in the table below: student description greg she drives at a variable speed for 2 minutes, then stops at a crossing for 2 minutes, and finally drives at a constant speed for the next 4 minutes. sam she drives at a variable speed for 2 minutes, then stops at a crossing for 4 minutes, and finally drives at a constant speed for the next 8 minutes. jane she drives at a variable speed for 2 minutes, then drives at a constant speed for the next 2 minutes, and finally drives at a variable speed for the next 4 minutes. pam she drives at a variable speed for 2 minutes, then drives at a constant speed for 4 minutes, and finally drives at a variable speed for the next 8 minutes. which student most accurately described lisa's motion? greg sam jane pam

Answers: 2


Another question on Mathematics
Mathematics, 21.06.2019 16:00
Explain step-by-step how to simplify -5(2x – 3y + 6z – 10).
Answers: 2
Mathematics, 21.06.2019 18:00
What is the rate of change of a line that passes through (2,-5) and (6,-2)?
Answers: 2
Mathematics, 21.06.2019 19:00
Write a fraction less than 1, which has a denominator of 6 and is greater than 3/4 plz answer !
Answers: 1
You know the right answer?
The graph below shows lisa's distance from her home (y), in miles, after a certain amount of time (x...
Questions

Biology, 25.07.2019 05:30

Social Studies, 25.07.2019 05:30
Mathematics, 25.07.2019 05:30


Chemistry, 25.07.2019 05:30
English, 25.07.2019 05:30

Business, 25.07.2019 05:30


