Questions with images:
2. the nonstandard distribution curve in the figure has a mean o...

Mathematics, 12.12.2019 22:31 saamiahs
Questions with images:
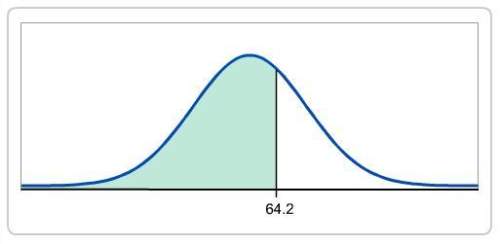
2. the nonstandard distribution curve in the figure has a mean of 553 and a standard deviation of 67. find the area of the shaded region.
-0.97
1.89
0.1660
0.8340
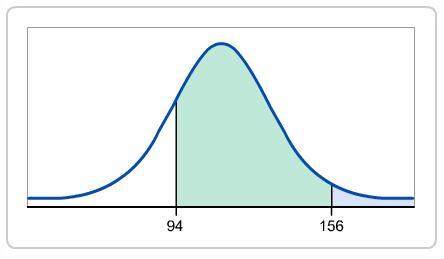
3. the data values in the normal distribution curve have of 112 with a standard deviation of 19.2. find the area of the shaded region.
0.8154
1.3500
0.1626
0.1846
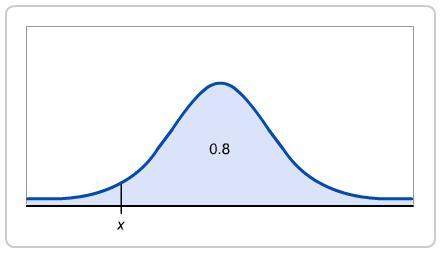
6. the figure shows a normal distribution curve with a mean of 3.47 and a standard deviation of 0.81. find the value of x, given that 80% of the values are greater than x.
5.13
2.79
1.95
2.06
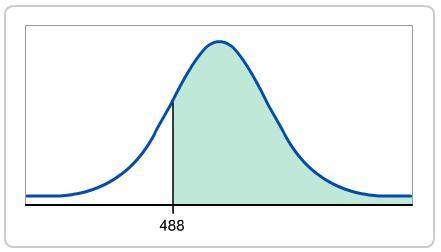
9. the graph shows a nonstandard normal distribution curve with a mean of 59.0 and a standard deviation of 6.7. find the area of the shaded region.
0.2177
0.7823
0.7761
0.3650
questions without images:
4. several science students used the same design when constructing a bridge out of balsa wood. they each tested the bridge's weight capacity using cups filled with sand. the weight capacities were recorded, and the results follow a normal distribution curve. the mean of the weights is 19.6 lb with a standard deviation of 1.3 lb. which weight is greater than 70% of the data?
19.99lb
20.51lb
18.92lb
20.29lb
5. a given set of values is found to be a normal distribution with a mean of 140 and a standard deviation of 18.0. find the value that is greater than 45% of the data values.
149.9
148.1
137.8
142.3
7. the scores of first-time players of a popular video game are recorded. the results follow a normal distribution curve. the results follow a normal distribution curve. the mean is 12388 points with a standard deviation of 953 points. what is the probability that a randomly selected player's score is more than 11950 points?
0.6772
0.3228
-0.46
0.1550
8. a set of data following a normal distribution has a mean of 192.3 and a standard deviation of 11.8. find the probability that a randomly selected value is less than 212.5.
0.0168
0.0436
0.5827
0.9564
10. a recent botany experiment showed a variety of results for the height of certain plants. the results followed a normal distribution with a mean of 8.4 feet and a standard deviation of 2.2 feet. find the probability that a randomly selected plant with have a height less than 6.0 feet.
0.9621
0.7257
0.1379
0.9861

Answers: 2


Another question on Mathematics
Mathematics, 21.06.2019 16:00
What value of x will make the triangles similar by the sss similarity theorem?
Answers: 3
Mathematics, 21.06.2019 16:40
The table shows the total distance that myra runs over different time periods. which describes myra’s distance as time increases? increasing decreasing zero constant
Answers: 2
Mathematics, 21.06.2019 20:50
Type the correct answer in each box, round your answers to the nearest integer 20 25 30 in the figure, the perimeter of hexagon abcdef is approximately w units, and its area is square units
Answers: 3
You know the right answer?
Questions
Mathematics, 22.04.2020 18:35

Mathematics, 22.04.2020 18:35
Business, 22.04.2020 18:35

History, 22.04.2020 18:35
History, 22.04.2020 18:35

Biology, 22.04.2020 18:35

Mathematics, 22.04.2020 18:35


Chemistry, 22.04.2020 18:35

Health, 22.04.2020 18:35
Biology, 22.04.2020 18:35


