
Mathematics, 17.11.2019 14:31 Nataliepavon7
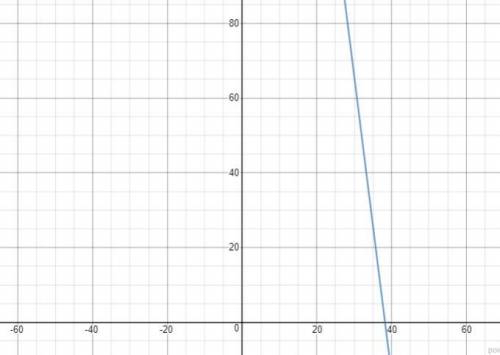
Hiro painted his room. after 3 hours of painting at a rate of 8 square meters per hour, he had 282 square meters left to paint. let y represent the area (in square meters) left to paint after xxx hours. which of the following information about the graph of the relationship is given

Answers: 3


Another question on Mathematics
Mathematics, 21.06.2019 15:50
Which of the following represents a number squared is equal to twenty more than nine times that number ? a) x squared = 9x + 20 b) x squared = 20x + 9 c) x squared > 9 + 20x d) x squared = 9 + x + 20
Answers: 2
Mathematics, 21.06.2019 20:30
Two angles are complementary. the larger angle is 36 more than the smaller angle. what is the measure of the larger angle?
Answers: 2
Mathematics, 22.06.2019 00:20
Four equations are shown below.equation 1: y=2*equation 2: y=2x-5equation 3: y=x2 + 6equation 4: tdentify one linear equation and one nonlinear equation from the list.why each equation you identified is linear or nonlinear.nd one nonlinear equation from the list. state a reasonlinear equation
Answers: 2
Mathematics, 22.06.2019 02:30
Atrain traveled for 1.5 hours to the first station, stopped for 30 minutes, then traveled for 4 hours to the final station where it stopped for 1 hour. the total distance traveled is a function of time. which graph most accurately represents this scenario? a graph is shown with the x-axis labeled time (in hours) and the y-axis labeled total distance (in miles). the line begins at the origin and moves upward for 1.5 hours. the line then continues upward at a slow rate until 2 hours. from 2 to 6 hours, the line continues quickly upward. from 6 to 7 hours, it moves downward until it touches the x-axis a graph is shown with the axis labeled time (in hours) and the y axis labeled total distance (in miles). a line is shown beginning at the origin. the line moves upward until 1.5 hours, then is a horizontal line until 2 hours. the line moves quickly upward again until 6 hours, and then is horizontal until 7 hours a graph is shown with the axis labeled time (in hours) and the y-axis labeled total distance (in miles). the line begins at the y-axis where y equals 125. it is horizontal until 1.5 hours, then moves downward until 2 hours where it touches the x-axis. the line moves upward until 6 hours and then moves downward until 7 hours where it touches the x-axis a graph is shown with the axis labeled time (in hours) and the y-axis labeled total distance (in miles). the line begins at y equals 125 and is horizontal for 1.5 hours. the line moves downward until 2 hours, then back up until 5.5 hours. the line is horizontal from 5.5 to 7 hours
Answers: 1
You know the right answer?
Hiro painted his room. after 3 hours of painting at a rate of 8 square meters per hour, he had 282 s...
Questions
Mathematics, 20.05.2021 03:40
Mathematics, 20.05.2021 03:40
Mathematics, 20.05.2021 03:40


English, 20.05.2021 03:40

Chemistry, 20.05.2021 03:40

History, 20.05.2021 03:40
Mathematics, 20.05.2021 03:40
History, 20.05.2021 03:40
History, 20.05.2021 03:40
Mathematics, 20.05.2021 03:40
Mathematics, 20.05.2021 03:40
Mathematics, 20.05.2021 03:40


