
Mathematics, 12.11.2019 07:31 augustmarie
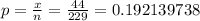
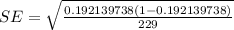
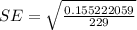
Assume that a sample is used to estimate a population proportion p. find the 99% confidence interval for a sample of size 229 with 44 successes. enter your answer as an open- interval (i. e., parentheses) using decimals (not percents) accurate to three decimal places.
99% c. i. =
answer should be obtained without any preliminary rounding. however, the critical value may be rounded to 3 decimal places.
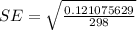
b. assume that a sample is used to estimate a population proportion p. find the 99% confidence interval for a sample of size 298 with 256 successes. enter your answer as a tri- linear inequality using decimals (not percents) accurate to three decimal places.
< p <
answer should be obtained without any preliminary rounding. however, the critical value may be rounded to 3 decimal places.
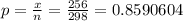
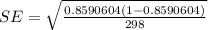
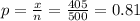
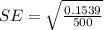
c. we wish to estimate what percent of adult residents in a certain county are parents. out of 500 adult residents sampled, 405 had kids. based on this, construct a 95% confidence interval for the proportion pp of adult residents who are parents in this county.
give your answers as decimals, to three places.
< pp <
d. if n=12, ¯xx¯(x-bar)=32, and s=13, construct a confidence interval at a 95% confidence level. assume the data came from a normally distributed population.
give your answers to one decimal place.

Answers: 1
 =1 - confidence = 1 - 0.99 = 0.01
 (from z-table)
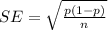
 (from z-table)
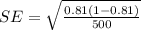
 (from t-table, two tails, df=11)
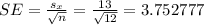


Another question on Mathematics
Mathematics, 21.06.2019 18:00
The given dot plot represents the average daily temperatures, in degrees fahrenheit, recorded in a town during the first 15 days of september. if the dot plot is converted to a box plot, the first quartile would be drawn at __ , and the third quartile would be drawn at __ link to graph: .
Answers: 1
Mathematics, 21.06.2019 19:30
Cor d? ? me ? max recorded the heights of 500 male humans. he found that the heights were normally distributed around a mean of 177 centimeters. which statements about max’s data must be true? a) the median of max’s data is 250 b) more than half of the data points max recorded were 177 centimeters. c) a data point chosen at random is as likely to be above the mean as it is to be below the mean. d) every height within three standard deviations of the mean is equally likely to be chosen if a data point is selected at random.
Answers: 1
Mathematics, 21.06.2019 20:00
Someone answer asap for ! the total ticket sales for a high school basketball game were $2,260. the ticket price for students were $2.25 less than the adult ticket price. the number of adult tickets sold was 230, and the number of student tickets sold was 180. what was the price of an adult ticket?
Answers: 1
Mathematics, 21.06.2019 22:30
Find the area of the region that is inside r=3cos(theta) and outside r=2-cos(theta). sketch the curves.
Answers: 3
You know the right answer?
Assume that a sample is used to estimate a population proportion p. find the 99% confidence interval...
Questions

Spanish, 15.10.2019 19:40
Mathematics, 15.10.2019 19:40
Mathematics, 15.10.2019 19:40
Mathematics, 15.10.2019 19:40
Mathematics, 15.10.2019 19:40

Social Studies, 15.10.2019 19:40
Mathematics, 15.10.2019 19:40

Chemistry, 15.10.2019 19:40
Mathematics, 15.10.2019 19:40
Mathematics, 15.10.2019 19:40

History, 15.10.2019 19:40

History, 15.10.2019 19:40

History, 15.10.2019 19:40


