
Mathematics, 12.11.2019 06:31 annjetero2oy23ay
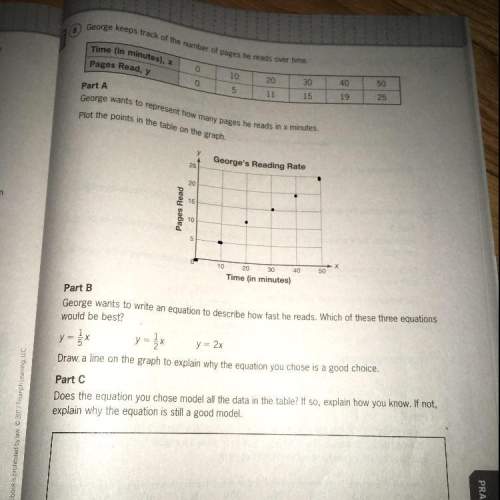
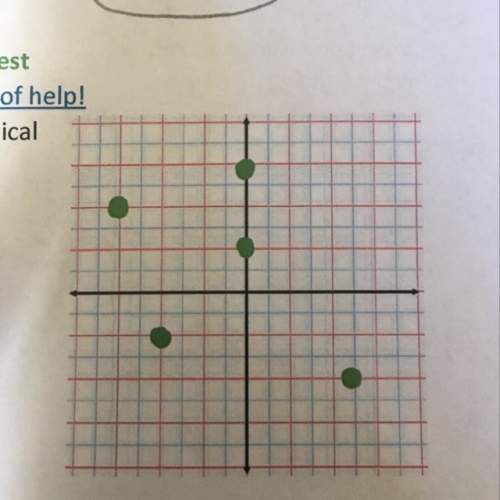
(02.05 mc) two similar triangles are shown on the coordinate grid: a coordinate grid is shown from positive 6 to negative 6 on the x-axis and from positive 6 to negative 6 on the y-axis. a triangle abc is shown with vertex a on ordered pair negative 2, negative 1, vertex b on ordered pair 0, 0, and vertex c on ordered pair 1, negative 3. a triangle a prime b prime c prime is also shown with vertex a prime on ordered pair negative 4, 2 , vertex b prime on ordered pair 0, 0 and vertex c prime on ordered pair 2, 6. which set of transformations has been performed on triangle abc to form triangle a′b′c′? (5 points) dilation by a scale factor of 4 followed by reflection about the x-axis dilation by a scale factor of 2 followed by reflection about the x-axis dilation by a scale factor of 4 followed by reflection about the y-axis dilation by a scale factor of 2 followed by reflection about the y-axis

Answers: 1


Another question on Mathematics
Mathematics, 21.06.2019 12:30
It takes evan 6 3/4 to mow 3 lawns. it takes 2 1/3 hours to mow me. gals lawn and 1 3/4 hot mow ms. lee’s lawn. how many hours does it take evan to mow the third lawn?
Answers: 1
Mathematics, 21.06.2019 16:00
Part one: measurements 1. measure your own height and arm span (from finger-tip to finger-tip) in inches. you will likely need some from a parent, guardian, or sibling to get accurate measurements. record your measurements on the "data record" document. use the "data record" to you complete part two of this project. name relationship to student x height in inches y arm span in inches archie dad 72 72 ginelle mom 65 66 sarah sister 64 65 meleah sister 66 3/4 67 rachel sister 53 1/2 53 emily auntie 66 1/2 66 hannah myself 66 1/2 69 part two: representation of data with plots 1. using graphing software of your choice, create a scatter plot of your data. predict the line of best fit, and sketch it on your graph. part three: the line of best fit include your scatter plot and the answers to the following questions in your word processing document 1. 1. which variable did you plot on the x-axis, and which variable did you plot on the y-axis? explain why you assigned the variables in that way. 2. write the equation of the line of best fit using the slope-intercept formula $y = mx + b$. show all your work, including the points used to determine the slope and how the equation was determined. 3. what does the slope of the line represent within the context of your graph? what does the y-intercept represent? 5. use the line of best fit to you to describe the data correlation.
Answers: 2
Mathematics, 21.06.2019 20:00
Another type of subtraction equation is 16-b=7. explain how you would sole this equation then solve it.
Answers: 2
You know the right answer?
(02.05 mc) two similar triangles are shown on the coordinate grid: a coordinate grid is shown from...
Questions
Mathematics, 30.06.2021 20:20

Chemistry, 30.06.2021 20:20


History, 30.06.2021 20:20
Spanish, 30.06.2021 20:20


Advanced Placement (AP), 30.06.2021 20:20


History, 30.06.2021 20:20
English, 30.06.2021 20:20
Mathematics, 30.06.2021 20:20


