
Mathematics, 04.11.2019 19:31 elian1418
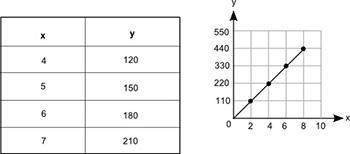
The table and the graph below each show a different relationship between the same two variables, x and y
how much more would the value of y be on the graph than its value in the table when x = 12?
150
300
450
600

Answers: 2


Another question on Mathematics
Mathematics, 21.06.2019 15:00
What are the constants in this expression? -10.6+9/10+2/5m-2.4n+3m
Answers: 3
Mathematics, 21.06.2019 19:00
Sanya noticed that the temperature was falling at a steady rate of 1.4 degrees every hour from the time that she first checked her outdoor thermometer. by 6 a.m., the temperature had fallen 21 degrees. which expression can you use to find how many hours earlier she had first checked the thermometer?
Answers: 3
Mathematics, 21.06.2019 22:00
Benjamin is making bow ties. how many 1/2yards lomg bow ties can he make if he has 18 feet of fabric?
Answers: 2
Mathematics, 22.06.2019 01:10
Jobs and productivity! how do retail stores rate? one way to answer this question is to examine annual profits per employee. the following data give annual profits per employee (in units of 1 thousand dollars per employee) for companies in retail sales. assume σ ≈ 4.0 thousand dollars. 3.7 6.7 3.6 8.5 7.5 5.9 8.7 6.4 2.6 2.9 8.1 −1.9 11.9 8.2 6.4 4.7 5.5 4.8 3.0 4.3 −6.0 1.5 2.9 4.8 −1.7 9.4 5.5 5.8 4.7 6.2 15.0 4.1 3.7 5.1 4.2 (a) use a calculator or appropriate computer software to find x for the preceding data. (round your answer to two decimal places.) thousand dollars per employee (b) let us say that the preceding data are representative of the entire sector of retail sales companies. find an 80% confidence interval for μ, the average annual profit per employee for retail sales. (round your answers to two decimal places.) lower limit -- thousand dollars upper limit -- thousand dollars (c) let us say that you are the manager of a retail store with a large number of employees. suppose the annual profits are less than 3 thousand dollars per employee. do you think this might be low compared with other retail stores? explain by referring to the confidence interval you computed in part (b). yes. this confidence interval suggests that the profits per employee are less than those of other retail stores. no. this confidence interval suggests that the profits per employee do not differ from those of other retail stores. correct: your answer is correct. (d) suppose the annual profits are more than 6.5 thousand dollars per employee. as store manager, would you feel somewhat better? explain by referring to the confidence interval you computed in part (b). yes. this confidence interval suggests that the profits per employee are greater than those of other retail stores. no. this confidence interval suggests that the profits per employee do not differ from those of other retail stores. (e) find an 95% confidence interval for μ, the average annual profit per employee for retail sales. (round your answers to two decimal places.) lower limit 3.75 incorrect: your answer is incorrect. thousand dollars upper limit 6.41 incorrect: your answer is incorrect. thousand dollars
Answers: 3
You know the right answer?
The table and the graph below each show a different relationship between the same two variables, x a...
Questions

History, 06.10.2020 14:01
Mathematics, 06.10.2020 14:01

Biology, 06.10.2020 14:01

Computers and Technology, 06.10.2020 14:01

Social Studies, 06.10.2020 14:01
History, 06.10.2020 14:01

English, 06.10.2020 14:01
Mathematics, 06.10.2020 14:01
History, 06.10.2020 14:01

Mathematics, 06.10.2020 14:01

Mathematics, 06.10.2020 14:01
Biology, 06.10.2020 14:01
Mathematics, 06.10.2020 14:01


