
Mathematics, 03.10.2019 06:10 brittanysanders
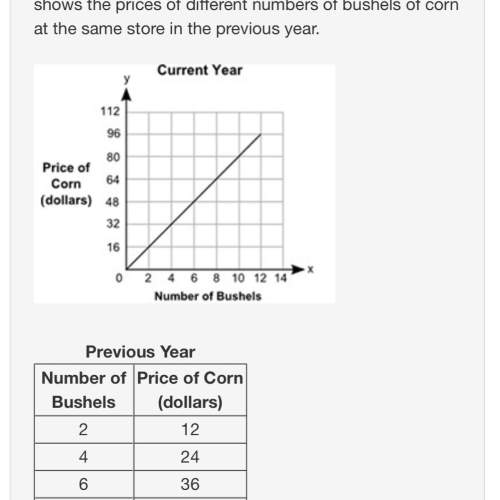
The graph shows the prices of different numbers of bushels of corn at a store in the current year. the table shows the prices of different numbers of bushels of corn at the same store in the previous year.
a graph shows number of bushels on x-axis and price of corn in dollars on y-axis. the x-axis scale is shown from 0 to 14 at increments of 2, and the y-axis scale is shown from 0 to 112 at increments of 16. a straight line joins the ordered pairs 2, 16 and 4, 32 and 6, 48 and 8, 64 and 10, 80 and 12, 96.
previous year
number of bushels
price of corn (dollars)
2
12
4
24
6
36
8
48
part a: describe in words how you can find the rate of change of a bushel of corn in the current year, and find the value. (5 points)
part b: how many dollars more is the price of a bushel of corn in the current year than the price of a bushel of corn in the previous year? show your work. (5 points)

Answers: 3


Another question on Mathematics
Mathematics, 21.06.2019 18:30
Is the square root of 4 plus the square root of 16 rational?
Answers: 2
Mathematics, 21.06.2019 20:00
The table below represents a linear function f(x) and the equation represents a function g(x): x f(x) −1 −5 0 −1 1 3 g(x) g(x) = 2x − 7 part a: write a sentence to compare the slope of the two functions and show the steps you used to determine the slope of f(x) and g(x). (6 points) part b: which function has a greater y-intercept? justify your answer. (4 points)
Answers: 2
Mathematics, 22.06.2019 01:40
Agroup of student volunteers participates in a study designed to assess several behavioral interventions for improving output in a repetitive task. prior to the beginning of the study, all volunteers unknowingly observed, and their output is measured. at the beginning of the study, prior to any intervention, the volunteers perform the same task under the observation of a study administrator, and their overall output increases. which of the following terms describes this phenomenon? a. simpson's paradox b. hawthorne effect are d. novelty effect d. pygmalion effect e. observer-expectancy effect
Answers: 1
Mathematics, 22.06.2019 01:50
Whats the theoretical probability of popping a polka dot balloon? express your answer as a fraction, decimal and percent solid 15 polka dot 5 striped 17 plzz me due tomorrow
Answers: 2
You know the right answer?
The graph shows the prices of different numbers of bushels of corn at a store in the current year. t...
Questions
Mathematics, 05.02.2021 04:20
Mathematics, 05.02.2021 04:20
Mathematics, 05.02.2021 04:20
Mathematics, 05.02.2021 04:20

English, 05.02.2021 04:20

Social Studies, 05.02.2021 04:20
Mathematics, 05.02.2021 04:20
Mathematics, 05.02.2021 04:20
Social Studies, 05.02.2021 04:20
Mathematics, 05.02.2021 04:20

Mathematics, 05.02.2021 04:20
Mathematics, 05.02.2021 04:20
English, 05.02.2021 04:20
Mathematics, 05.02.2021 04:20


