Luis created the graph below to show the temperature
from 8: 00 a. m. (8 hours after midnight)...

Mathematics, 17.08.2019 18:10 lucyamine0
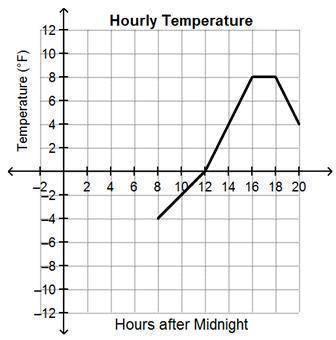
Luis created the graph below to show the temperature
from 8: 00 a. m. (8 hours after midnight) until 8: 00 pm
which statements are true about the temperatures luis
recorded on the graph? check all that apply.
hourly temperature
the temperature increased until 4: 00 p. m.
12%
the temperature was not recorded between 4: 00 pm
and 6: 00 pm
temperature (°f)
the temperature decreased after 6: 00 pm
the temperature increased and then decreased before
holding constant
1
2
4
6
8
10 12 14 16
18 20
w t
the temperature increased more quickly between 12: 00
pm and 4: 00 pm than before 12: 00 pm
op

Answers: 3


Another question on Mathematics
Mathematics, 21.06.2019 14:00
Alawn mower manufacturer incurs a total of 34,816 in overhead costs and 388 per lawn mower in production costs. how many lawn mowers were manufactured if the average cost of productions is 660
Answers: 3
Mathematics, 21.06.2019 14:30
Describe in detail how you would construct a 95% confidence interval for a set of 30 data points whose mean is 20 and population standard deviation is 3. be sure to show that you know the formula and how to plug into it. also, clearly state the margin of error.
Answers: 3
Mathematics, 21.06.2019 16:00
Write two subtraction equations that are equivalent to 5 + 12 = 17.
Answers: 2
You know the right answer?
Questions

History, 26.07.2019 06:00

Biology, 26.07.2019 06:00
Mathematics, 26.07.2019 06:00


Health, 26.07.2019 06:00
SAT, 26.07.2019 06:00


