
Mathematics, 27.06.2019 17:40 madisonmcelvany2404
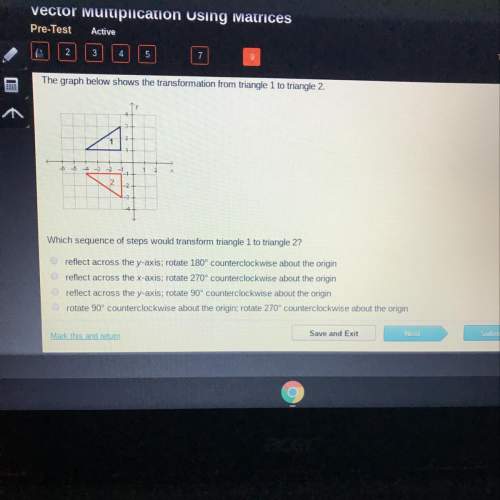
The graph below shows the transformation from triangle 1 to triangle 2. - which sequence of steps would transform triangle 1 to triangle 2? reflect across the y-axis; rotate 180° counterclockwise about the origin reflect across the x-axis; rotate 270° counterclockwise about the origin reflect across the y-axis; rotate 90° counterclockwise about the origin rotate 90° counterclockwise about the origin; rotate 270° counterclockwise about the origin

Answers: 1


Another question on Mathematics
Mathematics, 21.06.2019 16:00
The level of co2 emissions, f(x), in metric tons, from the town of fairfax x years after they started recording is shown in the table below. x 2 4 6 8 10 f(x) 26,460 29,172.15 32,162.29 35,458.93 39,093.47 select the true statement.
Answers: 1
Mathematics, 21.06.2019 17:00
The table shows population statistics for the ages of best actor and best supporting actor winners at an awards ceremony. the distributions of the ages are approximately bell-shaped. compare the z-scores for the actors in the following situation. best actor best supporting actor muequals42.0 muequals49.0 sigmaequals7.3 sigmaequals15 in a particular year, the best actor was 59 years old and the best supporting actor was 45 years old. determine the z-scores for each. best actor: z equals best supporting actor: z equals (round to two decimal places as needed.) interpret the z-scores. the best actor was (more than 2 standard deviations above more than 1 standard deviation above less than 1 standard deviation above less than 2 standard deviations below) the mean, which (is not, is) unusual. the best supporting actor was (less than 1 standard deviation below more than 1 standard deviation above more than 2 standard deviations below more than 1 standard deviation below) the mean, which (is is not) unusual.
Answers: 1
Mathematics, 21.06.2019 19:30
Which statements are true? check all that apply. the line x = 0 is perpendicular to the line y = –3. all lines that are parallel to the y-axis are vertical lines. all lines that are perpendicular to the x-axis have a slope of 0. the equation of the line parallel to the x-axis that passes through the point (2, –6) is x = 2. the equation of the line perpendicular to the y-axis that passes through the point (–5, 1) is y = 1.
Answers: 1
Mathematics, 21.06.2019 20:30
3.17 scores on stats final. below are final exam scores of 20 introductory statistics students. 1 2 3 4 5 6 7 8 9 10 11 12 13 14 15 16 17 18 19 20 57, 66, 69, 71, 72, 73, 74, 77, 78, 78, 79, 79, 81, 81, 82, 83, 83, 88, 89, 94 (a) the mean score is 77.7 points. with a standard deviation of 8.44 points. use this information to determine if the scores approximately follow the 68-95-99.7% rule. (b) do these data appear to follow a normal distribution? explain your reasoning using the graphs provided below.
Answers: 1
You know the right answer?
The graph below shows the transformation from triangle 1 to triangle 2. - which sequence of steps wo...
Questions

History, 12.03.2020 17:23


Social Studies, 12.03.2020 17:24

Computers and Technology, 12.03.2020 17:24
Mathematics, 12.03.2020 17:24
Computers and Technology, 12.03.2020 17:24

Mathematics, 12.03.2020 17:24

Chemistry, 12.03.2020 17:24
Mathematics, 12.03.2020 17:24


