
Mathematics, 27.06.2019 03:30 eric271828
In the graphing tool, choose the custom option in the relationship menu to graph the functions f(x) = x3 + 3 and g(x) = x2 + 2. adjust the zoom level of the graph so you can see the point where the two graphed functions intersect. then, left-click on the point where the functions intersect. the values of the point you click on, rounded to the nearest hundredth, will appear for about 2 seconds. note: if you’re not using a mouse (or a mouse with left-click ability), perform the equivalent zoom-in action on your device to see the intersection point values rounded to the nearest hundredth. then, approximate (to the nearest hundredth) the solution of f(x) = g(x) from part a of this question.

Answers: 1
 and
and 
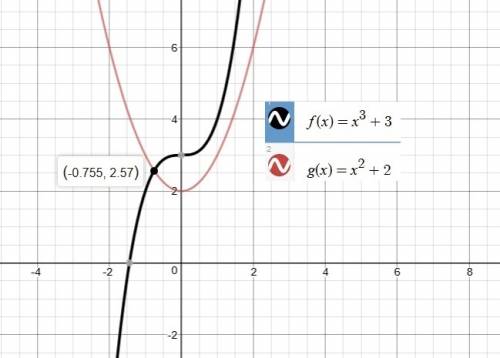
 we can just graph and see such point, or we can do some algebra to find it. This problem, specifically, asks an answer using a graphic method. The graph with both functions is attached.
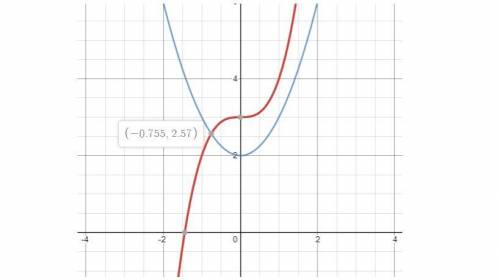


Another question on Mathematics
Mathematics, 21.06.2019 19:00
Which graph represents the parent function of y=(x+2)(x-2)
Answers: 1
Mathematics, 21.06.2019 20:00
How many sides does a regular polygon have if each exterior angle measure is 45 degrees explain your answer, i really don't understand this.
Answers: 1
Mathematics, 21.06.2019 22:30
Fast! find the length of cu. the triangles are similar. show your work.
Answers: 2
Mathematics, 22.06.2019 00:00
Alice is paying her bill at a restaurant. but tax on the cost of a male is 5%. she decides to leave a tip 20% of the cost of the meal plus the tax
Answers: 3
You know the right answer?
In the graphing tool, choose the custom option in the relationship menu to graph the functions f(x)...
Questions

Mathematics, 25.03.2021 17:20
Mathematics, 25.03.2021 17:20

Computers and Technology, 25.03.2021 17:20

Chemistry, 25.03.2021 17:20

Biology, 25.03.2021 17:20
Mathematics, 25.03.2021 17:20


History, 25.03.2021 17:20
Computers and Technology, 25.03.2021 17:20

Health, 25.03.2021 17:20
Mathematics, 25.03.2021 17:20


