Last questions! i need an 80% or above to pass !
the circle graph below shows the percentage...

Mathematics, 01.12.2019 00:31 dswitz6604
Last questions! i need an 80% or above to pass !
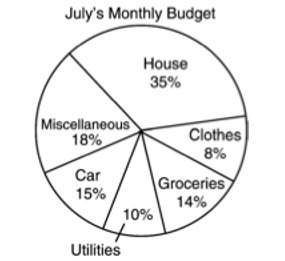
the circle graph below shows the percentages of mrs. frederick’s monthly budget for july. her total monthly income is $2,800.
pie chart below
in august’s monthly budget, mrs. frederick spent $126 more on clothes than she did in july. in august, what percentage of her monthly income of $2,800 was spent on clothes?
a 15%
b 12.5%
c 11.5%
d 10%
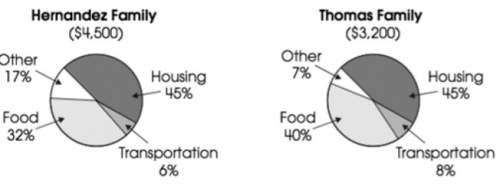
the hernandez family has a monthly income of $4,500. the thomas family has a monthly income of $3,200. the two circle graphs show the monthly budgets of two families.
pie charts below
which statement is supported by the data in the two graphs?
a the thomas family spends more dollars each month on transportation than the hernandez family does.
b the hernandez family spends more dollars each month on food than the thomas family does.
c both families spend more dollars on “other” than on transportation.
d both families spend the same amount of dollars each month on housing.
hassan deposited $7,500 into a bank account. at the end of 3 years, the account had earned $900 in simple interest. what rate of interest did the account earn per year?
a 2.78%
b 4%
c 8.33%
d 12%
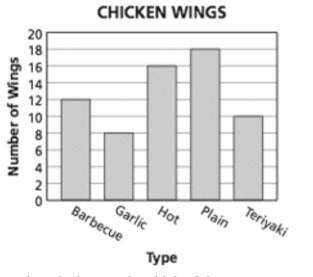
mr. wilt prepares some chicken wings for a picnic. the bar graph below shows the number of different types of wings he prepares.
bar graph below
based on the bar graph, which of these statements is true?
a mr. wilt prepares 2 more plain wings than hot wings.
b mr. wilt prepares twice as many plain wings as hot wings.
c mr. wilt prepares 2 more barbecue wings than garlic wings.
d mr. wilt prepares twice as many barbecue wings as garlic wings.
which of the following would be best represented by a circle graph?
a the heights of different types of trees
b the number of votes for each of 5 candidates for class president
c theamountofwaterthatfilledasinkafter 1,2, 3, and 4 minutes
d the number of hours each student studied compared to their grades on a test
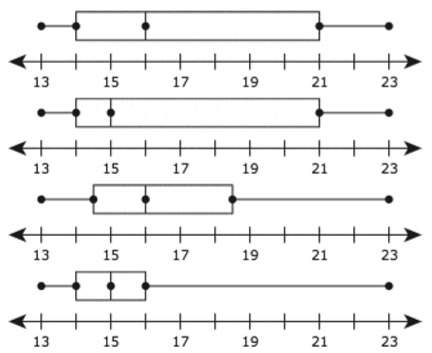
the ages of the members of a volunteer group are shown below. 13, 14, 14, 14, 15, 15, 15, 16, 16, 21, 23 which box and whisker plot best represents these data?
data below
a
b
c
d

Answers: 3


Another question on Mathematics
Mathematics, 21.06.2019 15:30
Find the number of positive three-digit even integers whose digits are among 9, 8, 7,5, 3, and 1.
Answers: 2
Mathematics, 21.06.2019 18:00
What does the relationship between the mean and median reveal about the shape of the data
Answers: 1
Mathematics, 21.06.2019 19:00
An energy drink company claims that its product increases students' memory levels. to support its claims, the company issues advertisements claiming that 8 out of 10 people (chosen randomly from across the country) who tried their product reported improved memory. the missing component in this study is a .
Answers: 1
Mathematics, 21.06.2019 19:00
Gh bisects fgi. find the measure of hgi •15° •21° •10° •8°
Answers: 2
You know the right answer?
Questions
Mathematics, 04.02.2020 06:03


Arts, 04.02.2020 06:03

Mathematics, 04.02.2020 06:03


English, 04.02.2020 06:03
Biology, 04.02.2020 06:03
Mathematics, 04.02.2020 06:03
Chemistry, 04.02.2020 06:03


Mathematics, 04.02.2020 06:03
History, 04.02.2020 06:03


