Look at the graph. Then answer the question.
1929 Drop in Stock Prices
A gra...

History, 09.04.2020 08:21 keshewar2671
Look at the graph. Then answer the question.
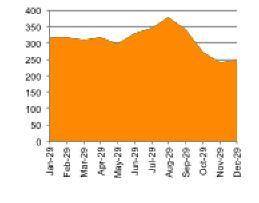
1929 Drop in Stock Prices
A graph titled 1929 Drop in Stock Prices shows dates on the horizontal axis and numbers on the vertical axis. Prices were constant around 300 from January to May, increased from 300 in May to 375 in August, decreased from 375 in August to 250 in November, and remained constant from November to December.
Which statement best explains what happened in the stock market from August to the end of October?
The market increased its value.
The market lost much of its value.
The market totally collapsed.
The market slowly inched upward.

Answers: 2


Another question on History
History, 20.06.2019 18:04
Pl type the correct answer in the box. spell all words correctly. the unofficial boundary that formed at the end of world war ii and divided europe into two sections was known as the
Answers: 1
History, 21.06.2019 20:50
Which region of georgia grows the most crops? appalachian plateau coastal plain piedmont ridge and valley
Answers: 1
History, 21.06.2019 23:00
One idea which permiates mande culture is the idea of dual gendered twinship. true false
Answers: 1
History, 21.06.2019 23:50
Which would be good historical evidence when studying manifest destiny?
Answers: 2
You know the right answer?
Questions


Mathematics, 02.02.2021 18:20

English, 02.02.2021 18:20

Mathematics, 02.02.2021 18:20
Mathematics, 02.02.2021 18:20
Mathematics, 02.02.2021 18:20


