Glapy suusa
quiz
active
time remaining
39: 57
a pie chart like this on...

History, 17.12.2019 18:31 sanchez626
Glapy suusa
quiz
active
time remaining
39: 57
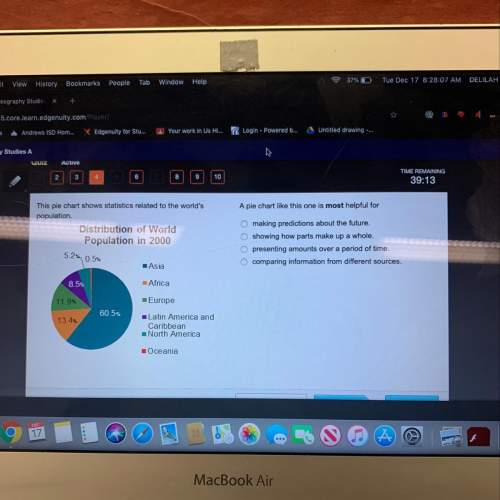
a pie chart like this one is most for
this pie chart shows statistics related to the world's
population.
distribution of world
population in 2000
o making predictions about the future.
o showing how parts make up a whole.
o presenting amounts over a period of time.
o comparing information from different sources.
5.2% 0.5%
asia
8.5%
africa
11.9%
europe
60.5%
13.4%
latin america and
caribbean
north america
oceania


Answers: 3


Another question on History

History, 21.06.2019 19:00
Western sahara is occupied by whom? a. mauritania b.algeria c. morocco d. tunisia
Answers: 2


History, 21.06.2019 23:00
Which roman emperor was responsible for a major shift in the dominate religious attitude of the roman empire?
Answers: 2

You know the right answer?
Questions


Computers and Technology, 28.07.2020 16:01


Mathematics, 28.07.2020 16:01

Mathematics, 28.07.2020 16:01


Mathematics, 28.07.2020 16:01

Health, 28.07.2020 16:01


