Geography, 22.10.2020 07:01 snikergrace
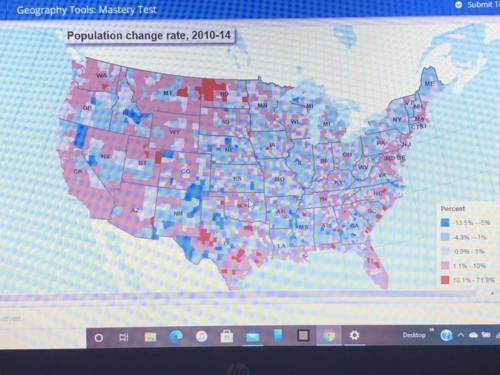
The map displays The rate of population change in United States between the year 2010 and 2014 based on the map which of the given TWO states show the largest increase in population
Texas
South Carolina
Colorado
North Dakota


Answers: 1


Another question on Geography

Geography, 23.06.2019 16:20
Data courtesy of the un development programme 2006-2008 and world bank 2009 the chart above compares measures of development using the hdi and gdp. why might turkey rank lower in the hdi indicator even though it has a high gdp? a. turkey has a lower gdp than comparable countries in the hdi ranking. b. turkey must increase its hdi to have a higher gdp ranking. c. turkey is only compared to other european countries in gdp, not to the world, as it is in the hdi. d. turkey may struggle to provide adequate education or health care, or it may have a lower life expectancy.
Answers: 1

Geography, 23.06.2019 19:30
Fossils of glossopteris, an extinct fern, were discovered on which continents to support the theory of continental drift? check all that apply.
Answers: 3


Geography, 24.06.2019 14:00
Who believed that the universe was made of tiny uncuttable particles
Answers: 2
You know the right answer?
The map displays The rate of population change in United States between the year 2010 and 2014 based...
Questions


Mathematics, 24.11.2020 23:10


Mathematics, 24.11.2020 23:10

Social Studies, 24.11.2020 23:10

Computers and Technology, 24.11.2020 23:10

Mathematics, 24.11.2020 23:10

Mathematics, 24.11.2020 23:10


History, 24.11.2020 23:10


History, 24.11.2020 23:10

Health, 24.11.2020 23:10

Mathematics, 24.11.2020 23:10


Mathematics, 24.11.2020 23:10


