
Computers and Technology, 22.01.2020 23:31 art3misdiangelo
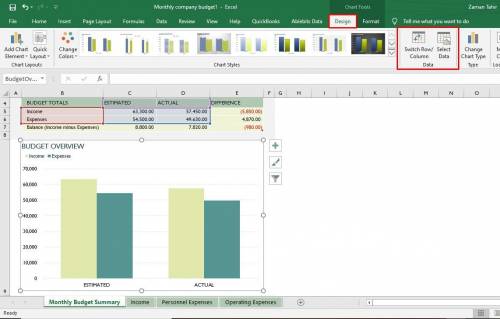
After a chart has been inserted and formatted, is it possible to change the data range it refers to or to add new rows of data? no, additional data cannot be included in a chart once it has been created; the user should delete the chart and create a new chart. yes, click the select data button in the data group under the design tab to extend or reduce the data range. yes, click the chart, select the additional rows or columns of data to add, and press enter on the keyboard. yes, double-click the chart and select properties from the list; in the properties box, insert the new data range to include in the chart.

Answers: 1


Another question on Computers and Technology
Computers and Technology, 21.06.2019 22:00
Which one of the following identifies the primary a purpose of information classification processes? a. define the requirements for protecting sensitive data.b. define the requirements for backing up data.c. define the requirements for storing data.d. define the requirements for transmitting data.
Answers: 2
Computers and Technology, 23.06.2019 08:00
Match the items with their respective descriptions.
Answers: 1
Computers and Technology, 23.06.2019 09:00
Which is the highest level of the hierarchy of needs model? a. humanity b. intrapersonal c. team d. interpersonal
Answers: 1
Computers and Technology, 23.06.2019 17:30
When making changes to optimize part of a processor, it is often the case that speeding up one type of instruction comes at the cost of slowing down something else. for example, if we put in a complicated fast floating-point unit, that takes space, and something might have to be moved farther away from the middle to accommodate it, adding an extra cycle in delay to reach that unit. the basic amdahl's law equation does not take into account this trade-off. a. if the new fast floating-point unit speeds up floating-point operations by, on average, 2ă—, and floating-point operations take 20% of the original program's execution time, what is the overall speedup (ignoring the penalty to any other instructions)? b. now assume that speeding up the floating-point unit slowed down data cache accesses, resulting in a 1.5ă— slowdown (or 2/3 speedup). data cache accesses consume 10% of the execution time. what is the overall speedup now? c. after implementing the new floating-point operations, what percentage of execution time is spent on floating-point operations? what percentage is spent on data cache accesses?
Answers: 2
You know the right answer?
After a chart has been inserted and formatted, is it possible to change the data range it refers to...
Questions

Mathematics, 20.11.2020 04:30
Mathematics, 20.11.2020 04:30
Mathematics, 20.11.2020 04:30
Mathematics, 20.11.2020 04:30

Mathematics, 20.11.2020 04:30

English, 20.11.2020 04:30
Mathematics, 20.11.2020 04:30
Mathematics, 20.11.2020 04:30
SAT, 20.11.2020 04:30
Mathematics, 20.11.2020 04:30

Business, 20.11.2020 04:30

Arts, 20.11.2020 04:30


