
Chemistry, 27.04.2021 01:00 angellll4455
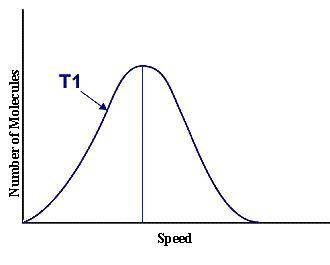
This graph represents a population of molecules in a gas versus the distribution of the average velocity(speed) of its molecules in that population. Assume all molecules to be of the same mass. In reading the graph, it is important to note three things. One, is the most probable speed is at the peak of the curve. Secondly, the most probable speed increases as the temperature increases (so shift to the right), and the distribution broadens as it increases.
On the graph, indicate the average kinetic energy of the population.
Explain your answer.
What part of the graph indicates the temperature of the sample?
Explain your answer.
Print out graph paper (click here for graph paper) and sketch a curve that represents the distribution of molecules at a temperature below the one shown. Label it as T2. Describe both T and T2 in terms of their average kinetic energy. Be specific and detailed.

Answers: 1


Another question on Chemistry
Chemistry, 21.06.2019 20:30
Pbco3 –> pbo+ co2. how many liters of carbon dioxide gas is produced from the decomposition of 32 grams of lead (ll) carbonate?
Answers: 1
Chemistry, 22.06.2019 13:00
The molality of calcium chloride (cacl2) in an aqueous solution is 2.46 m. what is mole fraction of the solute?
Answers: 3
Chemistry, 22.06.2019 16:40
Identify the lewis acid in this balanced equation: ag+ + 2nh3 -> ag(nh3)2+a. ag+b. nh3c. ag(nh3)2+
Answers: 1
Chemistry, 22.06.2019 18:00
How many moles of oxygen gas are produced from the decomposition of six moles of potassium
Answers: 1
You know the right answer?
This graph represents a population of molecules in a gas versus the distribution of the average velo...
Questions


Mathematics, 06.04.2020 18:59


Computers and Technology, 06.04.2020 18:59

English, 06.04.2020 18:59

Physics, 06.04.2020 18:59
English, 06.04.2020 18:59
Mathematics, 06.04.2020 18:59


