
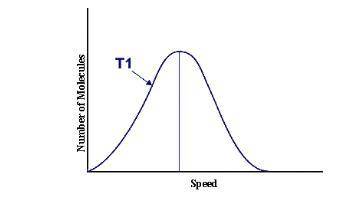
This graph represents a population of molecules in a gas versus the distribution of the average velocity(speed) of its molecules in that population. Assume all molecules to be of the same mass. In reading the graph, it is important to note three things. One, is the most probable speed is at the peak of the curve. Secondly, the most probable speed increases as the temperature increases (so shift to the right), and the distribution broadens as it increases.
On the graph, indicate the average kinetic energy of the population.
Explain your answer.
What part of the graph indicates the temperature of the sample?
Explain your answer.

Answers: 1


Another question on Chemistry
Chemistry, 21.06.2019 22:40
How many electrons does silver have to give up in order to achieve a sido noble gas electron configuration?
Answers: 3
Chemistry, 22.06.2019 20:00
What is the molar mass of the anhydrous compound? answer using four significant figures. 36.02 g/mol 120.15 g/mol 156.12 g/mol
Answers: 1
You know the right answer?
This graph represents a population of molecules in a gas versus the distribution of the average velo...
Questions


Mathematics, 18.09.2021 14:00
English, 18.09.2021 14:00

Mathematics, 18.09.2021 14:00

Social Studies, 18.09.2021 14:00
Mathematics, 18.09.2021 14:00

Computers and Technology, 18.09.2021 14:00
Computers and Technology, 18.09.2021 14:00
Social Studies, 18.09.2021 14:00

Mathematics, 18.09.2021 14:00


World Languages, 18.09.2021 14:00


