
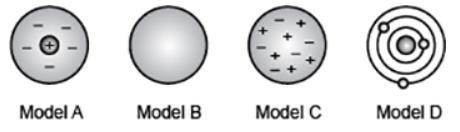
The diagram shows the different models of the atom that eventually led to the modern atomic theory. Four diagrams are shown labeled Model A, Model B, Model C, Model D from left to right. The diagram labeled Model A has a small sphere with a positive sign on it. This small sphere at the center is surrounded by a shaded circle. The shaded circle has negative signs placed randomly inside it. The diagram labeled Model B is a large shaded solid sphere. The diagram labeled Model C has positive and negative signs scattered in a shaded sphere. The diagram labeled Model D has a shaded sphere surrounded by three concentric circles. Each concentric circle has a sphere on it. Which model was proposed as a result of Rutherford's scattering experiment where positive particles did not pass straight through a foil as expected? (5 points) Model A Model B Model C Model D

Answers: 1


Another question on Chemistry
Chemistry, 21.06.2019 19:10
When will le chatelier's principle come into effect? at the beginning of a reaction, when there are only reactants when a reaction has reached chemical equilibrium when a catalyst is added to a reaction mixture when a reaction is occurring but not yet at equilibrium
Answers: 3
Chemistry, 22.06.2019 00:30
Lem 2 the data below are for the system ethyl propyl ether (1)-chloroform (2) at 0.5 bar. use the data to answer the following questions (all questions refer to p d 0: 5 bar). a) what are the boiling points of the pure components at 0.5 bar? b) a mixture with the overall composition z1 d 0: 1 is brought to 47.6ä±c, 0.5 bar. what is the phase? c) 100 mole of a mixture with z1 d 0: 1 (state a) is mixed with 22 mole of pure ethyl propyl ether vapor (state b). the mixing takes place at 47.6 ä±c, 0.5. bar. what is the phase of the resulting mixture (state c)? if the state is a v/l mixture report the number of moles and mole fractions in each phase. d) plot the txy graph and show states a, b and c. the graph must be done by computer and should be properly annotated. ethyl propyl ether (1) - chloroform (2) at 0.5 bar t ( ä±c) x1 y1 t ( ä±c) x1 y1 42.9 0.000 0.000 49.0 0.470 0.455 43.0 0.020 0.010 49.1 0.520 0.520 43.9 0.065 0.029 48.9 0.567 0.592 45.4 0.156 0.089 48.3 0.652 0.720 46.4 0.215 0.142 47.6 0.745 0.815 47.6 0.296 0.223 46.7 0.822 0.872 48.3 0.362 0.302 45.7 0.907 0.937 48.7 0.410 0.375 44.6 1.000
Answers: 3
Chemistry, 22.06.2019 11:00
Freezing and boiling are endothermic processes. this means that these processes absorb energy from their surroundings in order to occur. use this information and the data you collected in the phase change gizmo to describe what happens to the temperature of water when you boil it, then explain why this result occurs.
Answers: 1
Chemistry, 22.06.2019 16:00
How will the volume of a gas be affected if the pressure is tripled, but the temperature remains the same?
Answers: 3
You know the right answer?
The diagram shows the different models of the atom that eventually led to the modern atomic theory....
Questions

Business, 26.01.2021 23:20

Mathematics, 26.01.2021 23:20


English, 26.01.2021 23:20
Mathematics, 26.01.2021 23:20
English, 26.01.2021 23:20
Mathematics, 26.01.2021 23:20


Arts, 26.01.2021 23:20
Mathematics, 26.01.2021 23:20
History, 26.01.2021 23:20
Mathematics, 26.01.2021 23:20
English, 26.01.2021 23:20


