
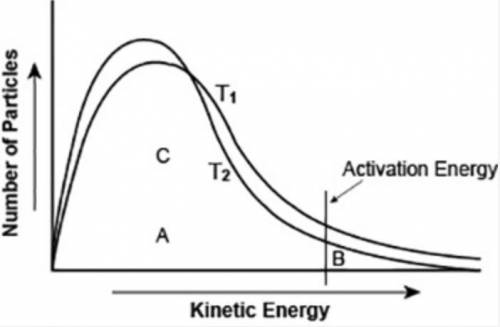
The graph shows the distribution of energy in the particles of two gas samples at different temperatures, T1 and T2. A, B, and C represent individual particles.
A graph is shown with two inverted graph curves running close to each other. One of the curves labeled T1 is slightly more spread out than the other labeled T2. The x axis of the graph has the title Kinetic Energy. The y axis of the graph has the title Number of Particles. A vertical line perpendicular to the x axis is shown. This vertical line is labeled Activation Energy. A point labeled B is shown on the right hand side of the vertical line. A point labeled A is shown in the lower left side of the vertical line. A particle labeled C is shown in the upper left side of the vertical line.
Based on the graph, which of the following statements is likely to be true?
Particle A and C are more likely to participate in the reaction than particle B.
Most of the particles of the two gases have very high speeds.
A fewer number of particles of gas at T1 are likely to participate in the reaction than the gas at T2.
The average speed of gas particles at T2 is lower than the average speed of gas particles at T1.

Answers: 1


Another question on Chemistry
Chemistry, 21.06.2019 13:10
Which equation represents a fission reaction? o "9n+h—150 o 235u + n—190cs + rb+25 o be + he—1c + in o 28 np —> 2390 pute
Answers: 1
Chemistry, 22.06.2019 00:40
Base your answer on the information below and on your knowledge of chemistry. nitrogen dioxide, no2, is a dark brown gas that is used to make nitric acid and to bleach flour. nitrogen dioxide has a boiling point of 294 k at 101.3 kpa. in a rigid cylinder with a movable piston, nitrogen dioxide can be in equilibrium with colorless dinitrogen tetroxide, n2o4. this equilibrium is represented by the equation below. 2no2(g) n2o4(g) + 58kj at standard pressure, compare the strength of intermolecular forces in no2(g) to the strength of intermolecular forces in n2(g).
Answers: 2
You know the right answer?
The graph shows the distribution of energy in the particles of two gas samples at different temperat...
Questions


Geography, 14.06.2021 14:50
English, 14.06.2021 14:50

Business, 14.06.2021 14:50

Mathematics, 14.06.2021 14:50
Mathematics, 14.06.2021 14:50
Mathematics, 14.06.2021 14:50
Mathematics, 14.06.2021 14:50

Health, 14.06.2021 14:50

Arts, 14.06.2021 14:50
Business, 14.06.2021 14:50
Mathematics, 14.06.2021 14:50

Advanced Placement (AP), 14.06.2021 14:50
Mathematics, 14.06.2021 14:50


