
Chemistry, 03.03.2021 01:40 trentonmccary2096
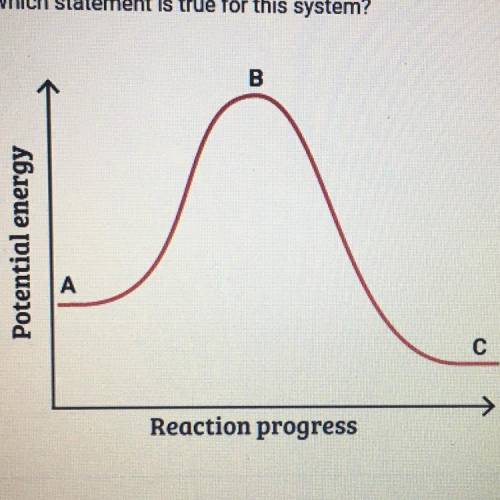
This graph shows how the potential energy of a reaction system changes
over time. Which statement is true for this system
A. The potential energy of the reactants is greater than the potential
energy of the products.
B. The height of the curve at point A represents the activation energy.
C. The height of the curve at point B represents the activation energy.
D. The potential energy of the products is greater than the potential
energy of the reactants.

Answers: 3


Another question on Chemistry
Chemistry, 21.06.2019 19:00
Does the temperature affect the solubility of sugar and salt in water? if it does tell me like different temperatures with different solubilities so i can sketch down a graph
Answers: 2
Chemistry, 22.06.2019 08:40
For each of the following compounds, write the formula then predict whether it would be a strong, weak, or non-electrolyte when placed in di water. for the ionic compounds only, put (s) or (aq) after the forrmula formula strong, weak or non electrolyte? a calcium hydroxide b. silver carbonate c. lead(ii) sulfate d. phosphorus trifluoride e. sodium phosphide f barium sulfate g. strontium acetate h. zinc nitrate
Answers: 3
Chemistry, 23.06.2019 11:30
How many grams of carbon are in 237 grams of ethanol(c2h5oh) and how many sulfide ions are in 2.45 moles of aluminum sulfide show me you you got the answers
Answers: 3
You know the right answer?
This graph shows how the potential energy of a reaction system changes
over time. Which statement i...
Questions


Physics, 11.12.2019 22:31
Mathematics, 11.12.2019 22:31
Mathematics, 11.12.2019 22:31

Spanish, 11.12.2019 22:31

Mathematics, 11.12.2019 22:31


