
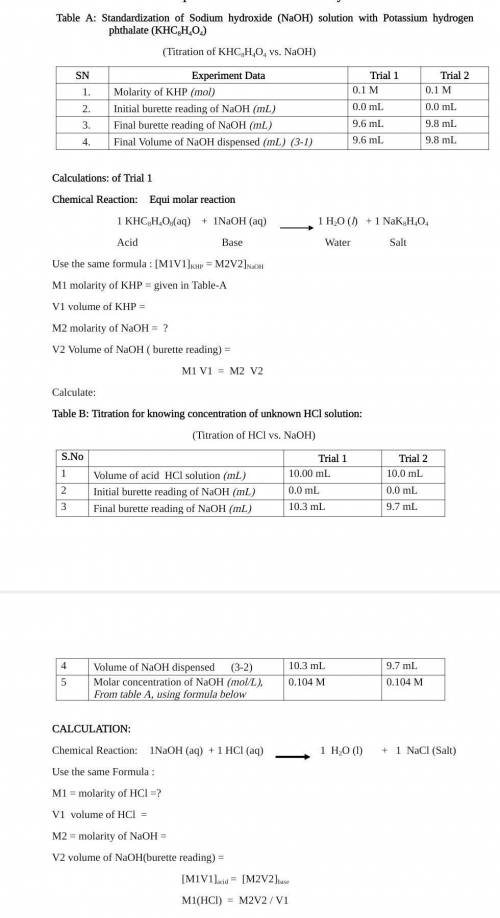
Standardization of Sodium hydroxide (NaOH) solution with Potassium
hydrogen phthalate (KHC2H404)
Table B: Titration for knowing concentration of unknown HCI solution:
(Titration of HCl vs. NaOH)
(Titration of KHCSH:04 vs. NaOH)
S. No
Trial 1
SN
1.
2.
3.
4.
Experiment Data
Molarity of KHP (nol)
Initial burette reading of NaOH (MI)
Fmal burette reading of NaOH (ml)
Final Volume of NaOH dispensed (m) (3-1)
Trial
01M
Q0 ml
9.6 TL
9.0
Trial 2
QUIM
0.0 mL
9.8 ml
9.5 mL
Volume of rid HCl solution (m)
10.00 mL
Intial burente reading of NaOH (m2
0.0 ml
Final burette reading of NaOH (ml)
103 m.
Volume of NaOH dispenyed (3-2)
10.3 ml
Mola concentribon of NaOH (mol). From table A, using 02104 M
Fortula balow
Trial 2
10 0 TL
0.0 ml
9.7 ml
9.1 ml
0.104 M
Calculations: of Trial 1
CALCULATION:
Chemical Reaction:
Equi molar reaction
1 H2O (1)
+ 1 NaCl
1 KHC8H4O3(aq) + 2NaOH(aq)
Chemical Reaction1NaOH (OCT + 1 HCI (aq)
(Salt)
1 H2O(l) +1 NK H404
Acid
Base
Water
Salt
Use the same Formula:
Use the same formula : MIV1]KHP = M2V2]NaOH
MI = molarity of HCI=?
M1 molarity of KHP=0.1 M
Vi volume of HCl =
V1 volume of KHP =
M2 =molarity of NaOH =
M2 molarity of NaOH = ?
V2 volume of NaOH(burette reading) =
V2 Volume of NaOH (burette reading) =
MIV1]acid = [MV2]b.
M1 V1 = M2 V2
M1(HCI) = M2V2/V1
Calculate:
Screens 1-2 of 2

Answers: 3


Another question on Chemistry
Chemistry, 22.06.2019 05:50
Astudent made a graph plotting the progress of a reaction over time. the student forgot to label the y-axis of the graph. a graph is shown with two graph lines. one graph line starts at a higher position on the y axis and slopes downwards towards the right. the other graph line starts at a lower position on the y axis and slopes upwards towards the right. the two graph lines stop short of intersecting each other and continue as separate lines which gradually become straight and parallel to the x axis. a vertical line is shown at a point where the two graph lines finally became parallel to the x axis. this vertical line is labeled equilibrium. the title on the x axis is time and an arrow pointing towards the right is shown above time. the title on the y axis is left blank. what best explains the label that the student should use on the y-axis? amount, because as the amount of product decreases, the amount of reactant increases over time. reaction rate, because forward and backward reaction become equal at equilibrium. amount, because the amounts of reactants and products become constant after equilibrium is reached. reaction rate, as the rate of forward reaction increases and rate of backward reaction decreases over time.
Answers: 3
Chemistry, 22.06.2019 15:00
Which substance is a steroid? cholesterol fatty acid monosaccharide trans fat
Answers: 1
Chemistry, 22.06.2019 15:00
20 pts ‼️ an unmanned spacecraft travels to mars. mars has a lower strength of gravity than earth. where in the image is the spacecraft’s weight the greatest?
Answers: 2
Chemistry, 23.06.2019 06:00
Each step in the following process has a yield of 70% ch4 + 4cl2 yield ccl4 +4hcl ccl4 + 2hf yield ccl2f2 + 2hcl of 4.50 mole ch4 reacts what is the total amount of hcl produced
Answers: 3
You know the right answer?
Standardization of Sodium hydroxide (NaOH) solution with Potassium
hydrogen phthalate (KHC2H404)
Questions

Mathematics, 02.08.2019 18:00


Social Studies, 02.08.2019 18:00
Chemistry, 02.08.2019 18:00

History, 02.08.2019 18:00
Mathematics, 02.08.2019 18:00
Mathematics, 02.08.2019 18:00


