
Chemistry, 24.06.2020 21:01 carlohillyard4633
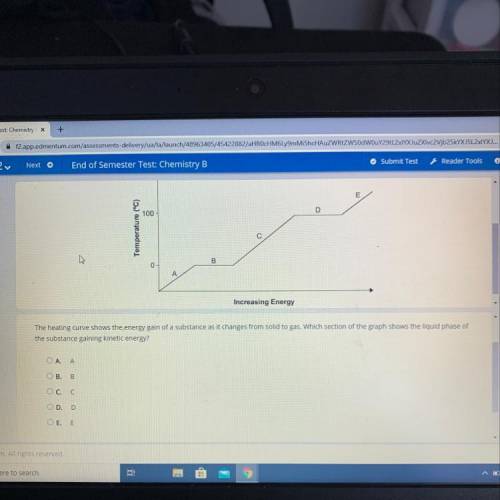
The heating curve shows the energy gain of a substance as it changes from solid to gas. Which section of the graph shows the liquid phase of the substance gaining kinetic energy?
A. A
B. B
C. C
D. D
E. E

Answers: 3


Another question on Chemistry
Chemistry, 22.06.2019 00:30
Water (2510 g ) is heated until it just begins to boil. if the water absorbs 5.09×10⁵ j of heat in the process, what was the initial temperature of the water?
Answers: 3
Chemistry, 22.06.2019 04:30
The big bang nucleosynthesis theory states that elements were produced in the first few minutes of the big bang while elements have their origins in the interiors of stars, forming much later in the history of the universe.
Answers: 1
Chemistry, 22.06.2019 17:30
I'm learning about the periodic tables and what each subject's configuration is. for example, hydrogen is 1s^1, but i don't understand how you get that. can someone me understand how to figure out how to figure this out? sorry if the question makes no sense, but it would really a lot if you could me understand! you so much if you can!
Answers: 1
Chemistry, 23.06.2019 04:00
Silver reacts with oxygen to produce silver oxide. (write balanced chemical equation and identify type of chemical reaction.)
Answers: 1
You know the right answer?
The heating curve shows the energy gain of a substance as it changes from solid to gas. Which sectio...
Questions


World Languages, 18.10.2019 07:30

Mathematics, 18.10.2019 07:30
Chemistry, 18.10.2019 07:30
Mathematics, 18.10.2019 07:30

Mathematics, 18.10.2019 07:30
Health, 18.10.2019 07:30
Mathematics, 18.10.2019 07:30


