
Chemistry, 28.02.2020 19:51 laurabwhiddon
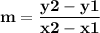
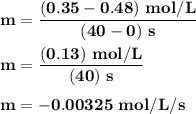
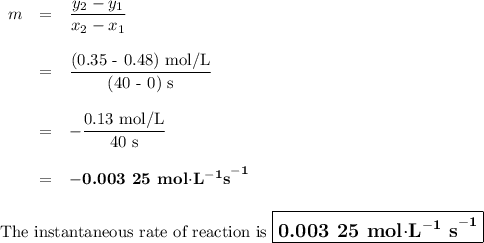
Time and concentration data were collected for the reaction A ⟶ products t (s) [A] (M) 0 0.52 20 0.43 40 0.34857 60 0.28538 80 0.23365 100 0.19130 The blue curve is the plot of the data. The straight orange line is tangent to the blue curve at t = 40 s. A plot has the concentration of A in molar on the y axis and time in seconds on the x axis. A curve contains the points (0, 0.52), (20, 0.43), (40, 0.35), (60, 0.29), (80, 0.24), and (100, 0.20). A line touches the curve at (40, 0.35) and has a y intercept of (0, 0.48). Approximate the instantaneous rate of this reaction at time t = 40 s.

Answers: 1
![Time and concentration data were collected for the reaction A ⟶ products t (s) [A] (M) 0 0.52 20 0.4](/tpl/images/0528/3101/b8cca.jpg)
![\begin{array}{rc}\textbf{t/s} & \textbf{[A]/mol$\cdot$L}^{\mathbf{-1}} \\0 & 0.52 \\20 & 0.43 \\40 & 0.35 \\60 & 0.29 \\80 & 0.24 \\100 & 0.20 \\\end{array}](/tpl/images/0528/3101/74b9f.png)


Another question on Chemistry
Chemistry, 21.06.2019 23:50
Working with si (metric) units for each of the following commonly used measurements, indicate its symbol. liter gram milliliter kilogram meter centigram milligram centimeter kilometer second millimeter milliseconds
Answers: 1
Chemistry, 22.06.2019 12:00
From the options provided for each element below, choose the properties that it may have based on its location in the periodic table fluorine (f): highly reactive nonmetal shiny a conductor
Answers: 1
Chemistry, 22.06.2019 12:20
Adeuteron, 21h, is the nucleus of a hydrogen isotope and consists of one proton and one neutron. the plasma of deuterons in a nuclear fusion reactor must be heated to about 3.02×10⁸ k . what is the rms speed of the deuterons? express your answer using two significant figures.
Answers: 1
Chemistry, 22.06.2019 14:00
Will mark brainliest how many electrons can be held in the energy level n = 4?
Answers: 1
You know the right answer?
Time and concentration data were collected for the reaction A ⟶ products t (s) [A] (M) 0 0.52 20 0.4...
Questions

English, 06.04.2021 19:20

Health, 06.04.2021 19:20

Mathematics, 06.04.2021 19:20

Advanced Placement (AP), 06.04.2021 19:20
Mathematics, 06.04.2021 19:20
Mathematics, 06.04.2021 19:20
Mathematics, 06.04.2021 19:20

Social Studies, 06.04.2021 19:20

History, 06.04.2021 19:20
Health, 06.04.2021 19:20
English, 06.04.2021 19:20
Advanced Placement (AP), 06.04.2021 19:20
English, 06.04.2021 19:20
Social Studies, 06.04.2021 19:20


