
Chemistry, 26.02.2020 17:01 vanessasantos2004vs
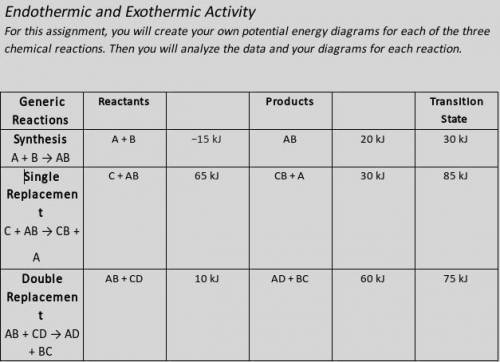
Illustrate the x- and y-axes to show the reaction pathway and potential energy, in kilojoules. Ensure your energy intervals are appropriate for the data.
Plot the enthalpy values of the reactants, products, and transition state using three horizontal dotted lines across the graph for each.
Draw the energy curve from the reactants line to the transition state and curve the line back down to the energy of the products. Label the reactants, products, and transition state.
Illustrate double-headed arrows to represent both the total change in enthalpy (ΔH) and the activation energy (Ea).
Calculate the total change in enthalpy and the activation energy using the energy values provided for each reaction. Record those values below the graph.
Make sure correct units are included.
I know this is a lot, so I'm giving more points than I ever have. Thank you!!!

Answers: 2


Another question on Chemistry
Chemistry, 22.06.2019 13:00
What is the mass of 2.00 l of an intravenous glucose solution with a density of 1.15 g/ml?
Answers: 2
Chemistry, 22.06.2019 17:00
What is the approximate vapor pressure when the gas condenses at 70 degrees celsius
Answers: 2
Chemistry, 23.06.2019 07:30
Can you guys answer these questions i need it before 1: 00pm
Answers: 3
You know the right answer?
Illustrate the x- and y-axes to show the reaction pathway and potential energy, in kilojoules. Ensur...
Questions


French, 24.02.2020 23:16


Mathematics, 24.02.2020 23:16
History, 24.02.2020 23:17


