Brain to best answer
city officials planned the placement of the playground, hiking trai...

Brain to best answer
city officials planned the placement of the playground, hiking trail, and parking lot around the pond. in response to concerns that polluted water would run off of the parking lot and into the pond when it rains, they decided to place the parking area as far from the pond as possible. a mulched playground was built on the other side of the pond, and a new hiking trail winds all the way around the pond. many trees were removed to make room for the parking lot, playground, and hiking trail. you job as an environmental scientist is to study the impact the park has on the pond ecosystem. the pond contains trout and catfish. catfish are very tolerant of pollution, but trout are much more sensitive and die off easily when exposed to excessive pollutants. before the land and pond were disturbed by the construction of the playground, hiking trail, and parking lot, you counted the number of fish in the pond. at that time, cypress pond contained 100 trout and 100 catfish. now you need to design an experiment to monitor the park’s impact on the populations of trout and catfish over the next 12 months.
1. what is the purpose of your experiment? (my answer was the purpose of this experiment is to the fish stay alive. )
2. develop a hypothesis for the experiment. (i need on this question )
3. what are the dependent and independent variables of your experiment? (i also need on this)
in this section, you will create a step-by-step procedure for testing and monitoring
the number of trout and catfish in cypress pond. you must monitor them once per
month for 12 months after the park is built.
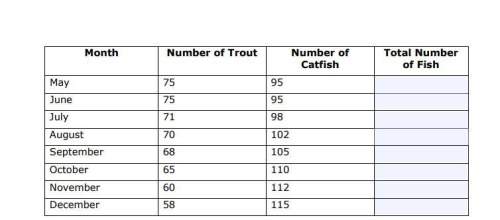
listed below are the results of your hard work. you monitored the populations of
trout and catfish in cypress pond every month for a year after the park was
developed. for each month, add the amount of both types of fish together. write
this total in the total number of fish column. present these results by creating a
line graph. (look at the picture)
(look at the 2nd picture) present these results by creating a line graph
1. what is the relationship between biotic and abiotic factors?
2. how did the construction of a parking lot, hiking trail, and playground affect
the fish populations in the pond?
3. what can happen to an animal species if it cannot adapt to changes taking
place in its habitat?
1. how would the ecosystem’s carrying capacity for a species change if the
species cannot adapt to changes in its habitat?
2. why are biologists concerned about ecosystem disruption?
3. if you were conducting this experiment in the real world, what might be
some possible sources of error in the experiment?


Answers: 2


Another question on Chemistry
Chemistry, 21.06.2019 13:00
Note the ph and poh values labeled with letters on the ph scale below. based on log rules and the way ph is calculated, what is the difference in [oh– ] concentration between point a and point b. a) 10^1 b) 10^5 c) 10^6 d) 10^7
Answers: 1
Chemistry, 22.06.2019 07:30
Using data from seismic waves, geologists have learned that earth’s interior is made up of several
Answers: 3
Chemistry, 22.06.2019 15:00
According to the diagram, what sources contribute to the phosphorus found in soil? according to the diagram, phosphorus found in soil contributes phosphorus to what other sources?
Answers: 1
Chemistry, 22.06.2019 17:30
A650 ml sodium bromine solution has a bromide ion concentration of 0.245 m. what is the mass (g) of sodium bromide in solution? a) 103.b)0.00155.c)16400.d) 16.4.e) 0.159
Answers: 2
You know the right answer?
Questions

English, 14.12.2020 15:40


Biology, 14.12.2020 15:40

History, 14.12.2020 15:40

Mathematics, 14.12.2020 15:40
Mathematics, 14.12.2020 15:40

Mathematics, 14.12.2020 15:50


