
Business, 08.11.2020 21:10 rodneydean5780
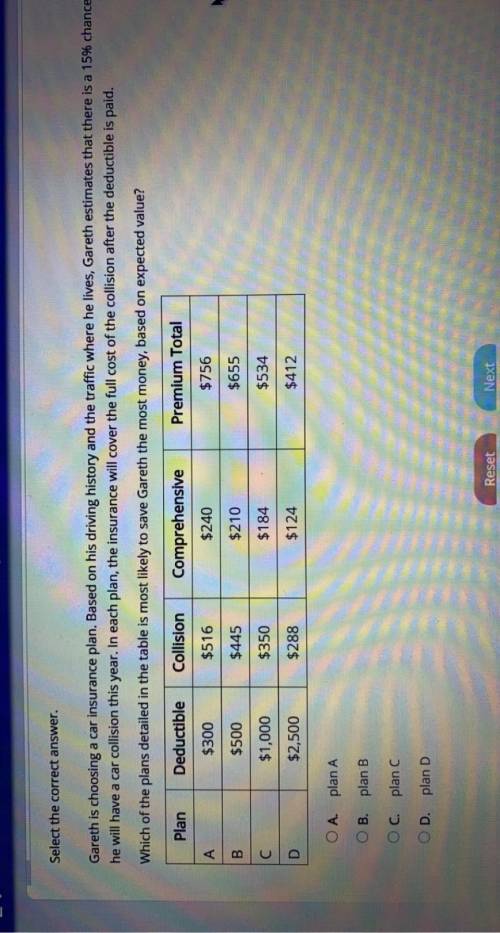
Gareth is choosing a car insurance plan. Based on his driving history and the traffic where he lives, Gareth estimates that there is a 15% chance he will have a car collision this year. In each plan, the insurance will cover the full cost of the collision after the deductible is paid.
Which of the plans detailed in the table is most likely to save Gareth the most money, based on expected value?
A.
plan A
B.
plan B
C.
plan C
D.
plan D

Answers: 3


Another question on Business
Business, 22.06.2019 19:00
Read the scenario. alfonso is 19 years old and has a high school diploma. recently, he was promoted to assistant manager at the fast-food restaurant where he has worked since the age of sixteen. his dream is to become the restaurant’s manager. what is his best option for achieving his dream? he should find another job and work his way up to a higher position. he should hope that his manager transfers to another location and that he is his replacement. he should attend classes at the local college to receive training in management. he should work hard, work longer hours, and remain assistant manager.
Answers: 2
Business, 22.06.2019 20:00
What is the difference between total utility and marginal utility? a. marginal utility is subject to the law of diminishing marginal utility while total utility is not. b. total utility represents the consumer optimum while marginal utility gives the total utility per dollar spent on the last unit. c. total utility is the total amount of satisfaction derived from consuming a certain amount of a good while marginal utility is the additional satisfaction gained from consuming an additional unit of the good. d. marginal utility represents the consumer optimum while total utility gives the total utility per dollar spent on the last unit.
Answers: 3
Business, 23.06.2019 01:00
Ticker services began operations in 2015 and maintains long-term investments in available-for-sale securities. the year-end cost and fair values for its portfolio of these investments follow.portfolio of available-for-sale securities cost fair valuedecember 31, 2015 $ 369,060 $ 357,988 december 31, 2016 420,728 445,972 december 31, 2017 572,190 676,901 december 31, 2018 864,007 768,966 prepare journal entries to record each year-end fair value adjustment for these securities.calculation adjustment required to fair value adjustment.12/31/15 existing balance in fair value adjustment-afs (lt) required balance in fair value adjustment-afs (lt) adjustment required to fair value adjustment-afs (lt) 12/31/16 existing balance in fair value adjustment-afs (lt) required balance in fair value adjustment-afs (lt) adjustment required to fair value adjustment-afs (lt) 12/31/17 existing balance in fair value adjustment-afs (lt) required balance in fair value adjustment-afs (lt) adjustment required to fair value adjustment-afs (lt) 12/31/18 existing balance in fair value adjustment-afs (lt) required balance in fair value adjustment-afs (lt) adjustment required to fair value adjustment-afs (lt) record the year-end adjusting entry for the securities portfolio as of december 31, 2015.date general journal debit creditdec 31, 2015 record the year-end adjusting entry for the securities portfolio as of december 31, 2016.date general journal debit creditdec 31, 2016 record the year-end adjusting entry for the securities portfolio as of december 31, 2017.date general journal debit creditdec 31, 2017 record the year-end adjusting entry for the securities portfolio as of december 31, 2018.date general journal debit creditdec 31, 2018
Answers: 2
Business, 23.06.2019 17:30
Monthly price data for mdltx and ekwax from yahoo finance is contained in the excel spreadsheet for this exercise. there are 37 months of price data for the period from september 2009 to september 2012. (note: these prices already incorporate dividend payments.) the 36 monthly returns for each fund are also provided. calculate average (arithmetic) monthly return and standard deviation for each fund. you can use the excel functions average, stdev to derive these stats. annualize these statistics. use the correl function in excel to derive the correlation coefficient between the two sets of returns. (annual correlation is the same as monthly correlation. hence, no need to annualize this stat.) using the annualized statistics derived in step 1, compute the expected return and standard deviation for portfolios containing from 0% to 100% mdltx (and 100% to 0% ekwax) by 10% increments. graph the resulting portfolios. based on your analysis, is there any potential benefit to diversification across these two funds? explain. of the 11 portfolios you graphed, which are efficient?
Answers: 1
You know the right answer?
Gareth is choosing a car insurance plan. Based on his driving history and the traffic where he lives...
Questions


Biology, 24.08.2019 06:30

Chemistry, 24.08.2019 06:30

Arts, 24.08.2019 06:30
Social Studies, 24.08.2019 06:30

Spanish, 24.08.2019 06:30
Chemistry, 24.08.2019 06:30


