
Business, 09.07.2019 04:30 angelbabynn05
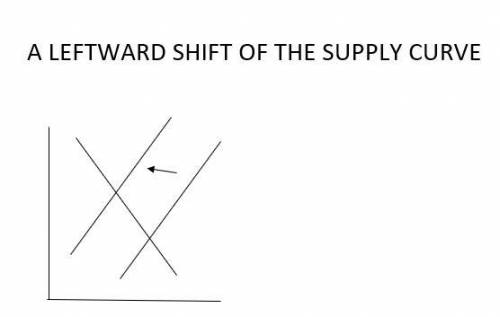
The market price of cheeseburgers in a college town increased recently, and the students in an economics class are debating the cause of the price increase. some students suggest that the price increased because several burger joints in the area have recently gone out of business. other students attribute the increase in the price of cheeseburgers to a recent increase in the price of calzones at local pizza parlors. everyone agrees that the increase in the price of calzones was caused by a recent increase in the price of pizza dough, which is not generally used in making cheeseburgers. assume that burger joints and pizza parlors are entirely separate entities' that is, there aren't places that serve both cheeseburgers and calzones. 1. the first group of students thinks the increase in the price of cheeseburgers is due to the fact that several burger joints in the area have recently gone out of business. on the following graph, adjust the supply and demand curves to illustrate the first groups explanation for the increase in the price of cheeseburgers. i don't have the graphs because i don't know how to input it onto the question but i would like to know the change for each graphs supply and demand lines either to the left or right. 2. the second group of students attributes the increase in the price of cheeseburgers to the increase in the price of calzones at local pizza parlors. on the following graph, adjust the supply and demand curves to illustrate the second group's explanation for the increase in the price of cheeseburgers. 3. suppose that both of the events you analyzed above are partly responsible for the increase in the price of cheeseburgers. based on your analysis of the explanations offered by the two groups of students, how would you figure out which of the possible causes was the dominant cause of the increase in the price of cheeseburgers? a) if the price increase was small, then the supply shift in the market for cheeseburgers must have been larger than the demand shift. b) if the equilibrium quantity of cheeseburgers increases, then the demand shift in the market for cheeseburgers must have been larger than the supply shift. c) if the equilibrium quantity of cheeseburgers increases, then the supply shift in the market for cheeseburgers must have been larger than the demand shift. d) whichever change occurred first must have been the primary cause of the change in the price of cheeseburgers.

Answers: 1


Another question on Business
Business, 21.06.2019 15:50
Aceramics manufacturer sold cups last year for $7.50 each. variable costs of manufacturing were $2.25 per unit. the company needed to sell 20,000 cups to break even. net income was $5,040. this year, the company expects the price per cup to be $9.00; variable manufacturing costs to increase 33.3%; and fixed costs to increase 10%. how many cups (rounded) does the company need to sell this year to break even?
Answers: 2
Business, 22.06.2019 12:50
Two products, qi and vh, emerge from a joint process. product qi has been allocated $34,300 of the total joint costs of $55,000. a total of 2,900 units of product qi are produced from the joint process. product qi can be sold at the split-off point for $11 per unit, or it can be processed further for an additional total cost of $10,900 and then sold for $13 per unit. if product qi is processed further and sold, what would be the financial advantage (disadvantage) for the company compared with sale in its unprocessed form directly after the split-off point?
Answers: 2
Business, 22.06.2019 15:20
Table 1. shows the expected demand for the dvd at different suggested donation levels, and they can act as a single-price monopolist if they choose to. thereceipts will be used to fund gstcg supplies for their data collection and conservation work. at the end of each sea turtle nesting season, any excess funds are donated by the gstcg to a local non-profit sea turtle research and rehabilitation facility. table 1 suggested anticipated total marginal profit donation per number of dvd revenue revenue dvd request requests $19.00 0 $15.00 2 $9.50 4 $7.75 10 $3.00 15 $0.00 20 a. complete table 1 by computing the total revenue, marginal revenue, and profit columns. b. the president wants the gstcg to provide videos to generate the most possible donations (total revenue). what price, if any, is the president of the gstcg favoring and how many people will receive the dvd if this becomes the price of the suggested donation? explain your answer. c. the education outreach committee wants the gstcg to provide videos to the highest possible number of people. what price, if any, is the educational outreach committee favoring and how many people will receive the dvd if this becomes the price of the suggested donation? explain your answer. d. the treasurer of the gstcg wants the dvd program to be as efficient as possible so that the marginal revenue equals marginal cost. what price, if any, is the treasurer favoring and how many people will receive the dvd if this becomes the price of the suggested donation? explain your answer. e. the fundraising committee wants the dvd program to generate as much profit in donations as possible. what price, if any, is the fundraising committee favoring and how many people will receive the dvd if this becomes the price of the suggested donation? explain your answer.
Answers: 3
Business, 22.06.2019 17:50
Variable rate cd’s = $90 treasury bills = $150 discount loans = $20 treasury notes = $100 fixed rate cds = $160 money market deposit accts. = $140 savings deposits = $90 fed funds borrowing = $40 variable rate mortgage loans $140 demand deposits = $40 primary reserves = $50 fixed rate loans = $210 fed funds lending = $50 equity capital = $120 a. develop a balance sheet from the above data. be sure to divide your balance sheet into rate-sensitive assets and liabilities as we did in class and in the examples. b. perform a standard gap analysis and a duration analysis using the above data if you have a 1.15% decrease in interest rates and an average duration of assets of 5.4 years and an average duration of liabilities of 3.8 years. c. indicate if this bank will remain solvent after the valuation changes. if so, indicate the new level of equity capital after the valuation changes. if not, indicate the amount of the shortage in equity capital.
Answers: 3
You know the right answer?
The market price of cheeseburgers in a college town increased recently, and the students in an econo...
Questions


English, 03.11.2020 19:50

Mathematics, 03.11.2020 19:50
Mathematics, 03.11.2020 19:50
History, 03.11.2020 19:50
Mathematics, 03.11.2020 19:50

Social Studies, 03.11.2020 19:50
History, 03.11.2020 19:50

Mathematics, 03.11.2020 19:50

Computers and Technology, 03.11.2020 19:50


