
Biology, 30.11.2021 01:00 lclaudettecarte4720
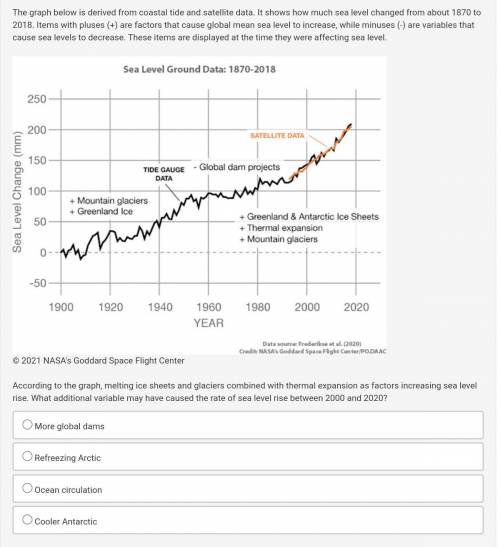
The graph below is derived from coastal tide and satellite data. It shows how much sea level changed from about 1870 to 2018. Items with pluses (+) are factors that cause global mean sea level to increase, while minuses (-) are variables that cause sea levels to decrease. These items are displayed at the time they were affecting sea level. Graph shows sea levels starting in 1900 and includes events that lead to increases and decreases in sea level. In 1900, sea level change is set to zero. In 1920, sea level rose 20 millimeters. In 1940, sea level rose to 50 millimeters. In 1960, sea level rose to 100 millimeters. In 1980, sea level rose to 125 millimeters. In 2000, sea level rose to 150. By 2020, sea-level rises 200 millimeters. © 2021 NASA's Goddard Space Flight Center According to the graph, melting ice sheets and glaciers combined with thermal expansion as factors increasing sea level rise. What additional variable may have caused the rate of sea level rise between 2000 and 2020? More global dams Refreezing Arctic Ocean circulation Cooler Antarctic

Answers: 2


Another question on Biology
Biology, 22.06.2019 03:00
Where does all the water go? according to the environmental protection agency (epa), in a typical wetland environment, 39% of the water is outflow; 46% is seepage; 7% evaporates; and 8% remains as water volume in the ecosystem (reference: united states environmental protection agency case studies report 832-r-93-005). chloride compounds as residuals from residential areas are a problem for wetlands. suppose that in a particular wetland environment the following concentrations (mg/l) of chloride compounds were found: outflow, 60.4; seepage, 73.7; remaining due to evaporation, 26.4; in the water volume, 46.8. (a) compute the weighted average of chlorine compound concentration (mg/l) for this ecological system. (round your answer to one decimal place.) mg/l (b) suppose the epa has established an average chlorine compound concentration target of no more than 58 mg/l. does this wetlands system meet the target standard for chlorine compound concentration? yes. the average chlorine compound concentration (mg/l) is too high. yes. the average chlorine compound concentration (mg/l) is lower than the target. no. the average chlorine compound concentration (mg/l) is lower than the target. no. the average chlorine compound concentration (mg/l) is too high.
Answers: 3
Biology, 22.06.2019 03:00
Nhumans, abo blood types refer to glycoproteins in the membranes of red blood cells. there are three alleles for this autosomal gene: ia, ib, and i. the ia allele codes for the a glycoprotein, the ib allele codes for the b glycoprotein, and the i allele doesn't code for any membrane glycoprotein. ia and ib are codominant, and i is recessive to both ia and ib. people with type a blood have the genotypes iaia or iai, people with type b blood are ibib or ibi, people with type ab blood are iaib, and people with type o blood are ii. if a woman with type ab blood marries a man with type o blood, which of the following blood types could their children possibly have? in humans, abo blood types refer to glycoproteins in the membranes of red blood cells. there are three alleles for this autosomal gene: ia, ib, and i. the ia allele codes for the a glycoprotein, the ib allele codes for the b glycoprotein, and the i allele doesn't code for any membrane glycoprotein. ia and ib are codominant, and i is recessive to both ia and ib. people with type a blood have the genotypes iaia or iai, people with type b blood are ibib or ibi, people with type ab blood are iaib, and people with type o blood are ii. if a woman with type ab blood marries a man with type o blood, which of the following blood types could their children possibly have? a, b, ab, and o ab and o a, b, and o a and b
Answers: 1
Biology, 22.06.2019 09:20
Stephen is a student who wants to test his knowledge of medical terminology. which option could he use?
Answers: 1
You know the right answer?
The graph below is derived from coastal tide and satellite data. It shows how much sea level changed...
Questions

English, 23.11.2020 06:10

Social Studies, 23.11.2020 06:10

Biology, 23.11.2020 06:10

Mathematics, 23.11.2020 06:10
English, 23.11.2020 06:10
English, 23.11.2020 06:10

Health, 23.11.2020 06:10
Mathematics, 23.11.2020 06:10
Mathematics, 23.11.2020 06:10

Arts, 23.11.2020 06:10
Mathematics, 23.11.2020 06:10
Mathematics, 23.11.2020 06:10

Mathematics, 23.11.2020 06:10
English, 23.11.2020 06:10


