
Biology, 19.05.2021 17:30 jeffffffff
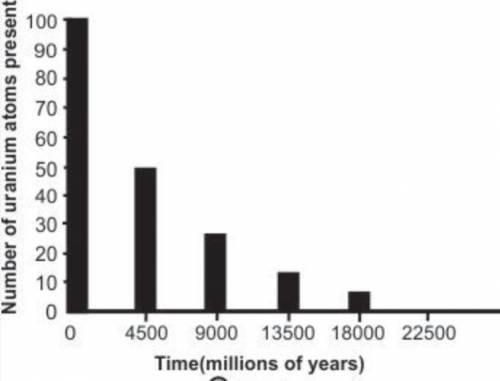
The graph below shows the radioactive decay of an isotope of uranium.
Bar graph showing time in millions of years on x axis and number of uranium atoms present on y axis. Height of bar corresponding to time 0 million years is 100; time 4500 million years is 50; time 9000 million years is 25; time 13,500 million years is 12.5; and time 18,000 million years is 6.25.
Based on the graph, what is the half-life of uranium?
50 years
100 years
4,500 years
9,000 years

Answers: 2


Another question on Biology
Biology, 22.06.2019 04:30
The nursing instructor has been observing nursing students initiate an iv infusion. which action(s), if made by the nursing student, indicates that further instruction is needed? (select all that apply.) the nursing student:
Answers: 1
Biology, 22.06.2019 09:00
The two tubes contain bromothymol blue. after 24 hours, what will the color of the water be in tube b? a. green (it won't change) b. yellow c. blue d. colorless (clear)
Answers: 1
You know the right answer?
The graph below shows the radioactive decay of an isotope of uranium.
Bar graph showing time in mil...
Questions

Computers and Technology, 26.11.2019 21:31


Chemistry, 26.11.2019 21:31


Computers and Technology, 26.11.2019 21:31


