
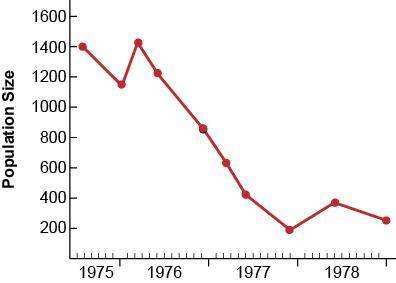
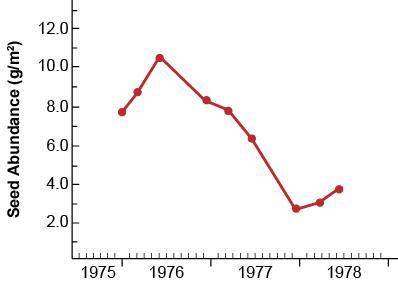
The graph shows the variation in the population size of finches living on one of the Galápagos Islands.
The finches' only food source is seeds found on the island. The seed abundance on the island during the same time period is shown.
What explanation can be constructed based on the evidence in the two graphs?
A
Higher seed abundance results in a lower population size of finches.
B
Lower seed abundance results in a greater population size of finches.
C
Higher seed abundance results in a greater population size of finches.
D
Changes in seed abundance do not affect the population size of finches.

Answers: 1


Another question on Biology
Biology, 21.06.2019 21:30
Now it's your turn to investigate human impact around the world. grab your virtual lab coat and put on your environmental science hat. you will be taking a trip around the globe to explore three locations. at each location, you will investigate the cause and effect relationships of deforestation, desertification, and urbanization. you will also gather evidence of how these factors have impacted the environment over time
Answers: 1
Biology, 22.06.2019 01:30
Which is an advantage of having memory cells when a pathogen is encountered for a second time. a) the memory cells are what proliferate into clones of cells in response to the binding of an antigen. b) memory cells are vital to the primary immune response in that they immediately recognize pathogens even at the first encounter. c) memory cells are essentially effector cells that are short lived and attack antigens even without having a receptor specific to that antigen. d) it ensures that more lymphocytes with a receptor specific to a particular antigen will be present than in a host that had never encountered that pathogen.
Answers: 1
Biology, 22.06.2019 04:10
What noticeable trend from this graph might be used to make a conclusion?
Answers: 1
Biology, 22.06.2019 05:10
Hydrilla (hydrilla verticillata) is an invasive aquatic plant and one of the most serious aquatic pests in florida. hydrilla has already been introduced to hundreds of bodies of water throughout florida, hydrilla is difficult to control because it grows rapidly and survives in many different water depths and conditions. hydrilla • describe how hydrilla affects native plant and animal species. include both a biotic and an abiotic limiting factor. • suggest one biotic and one abiotic recommendation that could slow the spread of hydrilla
Answers: 3
You know the right answer?
The graph shows the variation in the population size of finches living on one of the Galápagos Islan...
Questions

Social Studies, 08.10.2019 14:50

Mathematics, 08.10.2019 14:50

Mathematics, 08.10.2019 14:50
Mathematics, 08.10.2019 14:50
Mathematics, 08.10.2019 14:50
English, 08.10.2019 14:50
Mathematics, 08.10.2019 14:50

Physics, 08.10.2019 14:50

History, 08.10.2019 14:50

Arts, 08.10.2019 14:50
Mathematics, 08.10.2019 14:50
History, 08.10.2019 14:50


