POS
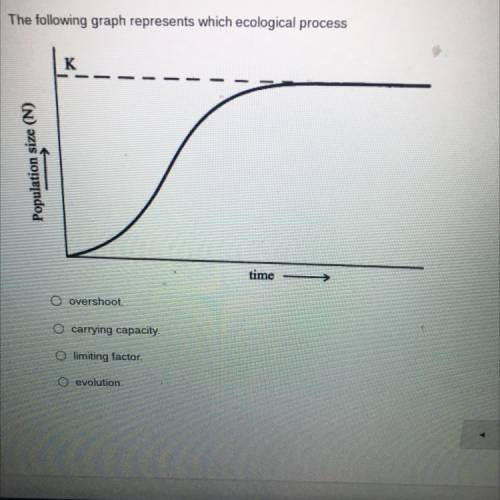
The following graph represents which ecological process
size (N)
Population sa
time
O overshoot.
Ο Ο Ο
O carrying capacity
O limiting factor.
O evolution
Biology students used raw eggs in an experiment on tonicity and osmosis. the students put their eggs into vinegar to remove the shells. the vinegar was used to remove the shell from the raw egg. what other effect(s) did the vinegar have on the egg?